Range Rule of Thumb: Estimate Data Spread Easily
The range rule of thumb serves as a practical method in descriptive statistics, offering a quick estimation of data dispersion. Six Sigma methodologies often utilize this rule to assess process variation, providing a simplified approach compared to calculating standard deviation. The concept, frequently taught in introductory statistics courses at institutions such as the Khan Academy, leverages the range of a dataset to approximate its standard deviation. For quality control engineers at companies like General Electric, the range rule of thumb provides an accessible tool for initial data analysis and process monitoring.
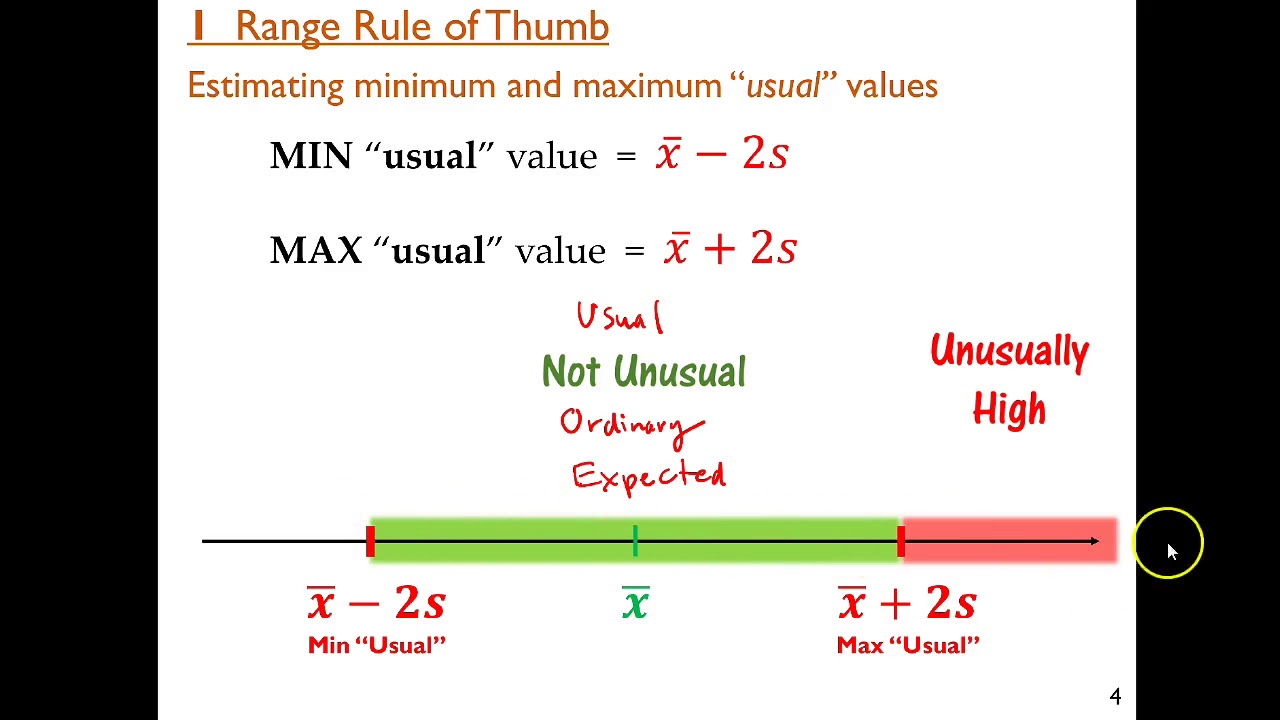
Image taken from the YouTube channel Jim Yang , from the video titled Range Rule of Thumb .
The Range Rule of Thumb: A Swift Estimator of Standard Deviation
The Range Rule of Thumb offers a remarkably simple approach to approximating the standard deviation of a dataset.
It serves as a practical tool when a rapid, albeit less precise, understanding of data spread is required.
This method is particularly valuable in scenarios where detailed calculations are impractical or time-sensitive.
Defining the Range Rule of Thumb
At its core, the Range Rule of Thumb is a technique for estimating the standard deviation.
It relies on the range of a dataset, which is simply the difference between the maximum and minimum values.
The standard deviation, a measure of data dispersion around the mean, can be quickly approximated using this rule.
Purpose: Rapid Approximation of Data Spread
The primary purpose of the Range Rule of Thumb is to provide a quick estimate of data spread.
Instead of complex calculations, it leverages the range, an easily obtainable value, to gauge variability.
This is especially helpful in preliminary data analysis or when making quick comparisons between datasets.
Importance: Utility in Rapid Assessments
The real strength of the Range Rule of Thumb lies in its utility for rapid assessments.
In situations demanding an immediate understanding of data variability, this rule provides a fast answer.
It's vital to remember that this speed comes at the cost of absolute precision.
Therefore, it's most appropriate when a rough estimate suffices and precise calculations are not immediately necessary.
Understanding the Core: Principles and Calculation
The Range Rule of Thumb offers a remarkably simple approach to approximating the standard deviation of a dataset. It serves as a practical tool when a rapid, albeit less precise, understanding of data spread is required. This method is particularly valuable in scenarios where detailed calculations are impractical or unnecessary.
The Range Rule as a Statistical Estimation Tool
The Range Rule of Thumb operates as a form of statistical estimation. Unlike precise statistical calculations that rely on complex formulas and the entire dataset, this rule provides an approximation. It leverages a single, easily obtainable metric—the range—to infer information about the data's dispersion. This simplification, while sacrificing some accuracy, enables quick assessments and educated guesses about the data's standard deviation.
Approximating Standard Deviation
The key to understanding the Range Rule lies in recognizing its primary purpose: to approximate the standard deviation. The standard deviation, a fundamental measure of data variability, quantifies how spread out the data points are around the mean. The Range Rule offers a shortcut for estimating this value without performing the full calculation, which often involves summing squared differences from the mean.
The Calculation Explained: Diving the Range by Four
The core calculation of the Range Rule of Thumb is straightforward. It involves dividing the range of the dataset by a constant factor, typically 4.
More formally:
Estimated Standard Deviation ≈ Range / 4
Where the "Range" is calculated as:
Range = Maximum Value - Minimum Value
The rationale behind dividing by 4 stems from the properties of a normal distribution. In a perfectly normal distribution, approximately 95% of the data falls within two standard deviations of the mean. Thus, the range, representing the difference between the maximum and minimum values, roughly corresponds to four standard deviations. Dividing the range by 4, therefore, provides an estimate of a single standard deviation.
It's crucial to remember that this calculation is an estimation, and its accuracy depends on the underlying distribution of the data. Deviations from normality, particularly the presence of outliers, can significantly impact the reliability of the estimated standard deviation.
Accuracy Factors: When the Rule Works Best (and When It Doesn't)
The Range Rule of Thumb offers a remarkably simple approach to approximating the standard deviation of a dataset. It serves as a practical tool when a rapid, albeit less precise, understanding of data spread is required. This method is particularly valuable in scenarios where detailed calculations are either impractical or impossible.
However, like any estimation technique, the Range Rule of Thumb operates under certain assumptions and is influenced by several factors that can significantly impact its accuracy. Understanding these factors is crucial for interpreting the resulting estimate and recognizing its limitations.
The Influence of a Normal Distribution
The Range Rule of Thumb is most accurate when applied to datasets that follow a normal distribution, often visualized as a bell curve. In a perfectly normal distribution, the data is symmetrically distributed around the mean, and the range encompasses a predictable portion of the data's spread.
When data deviates significantly from a normal distribution, the rule's accuracy diminishes. Skewed distributions, for instance, where data is concentrated on one side of the mean, can lead to a range that misrepresents the typical deviation of data points from the average.
Relation to the Empirical Rule (68-95-99.7 Rule)
The effectiveness of the Range Rule of Thumb in normally distributed data is closely linked to the Empirical Rule, also known as the 68-95-99.7 rule. This rule states that for a normal distribution, approximately 68% of the data falls within one standard deviation of the mean, 95% within two standard deviations, and 99.7% within three standard deviations.
Because the range is calculated between the minimum and maximum values, in a near-normal distribution, this range is expected to encompass a segment related to several standard deviations. The Range Rule of Thumb exploits this property by approximating the standard deviation as the range divided by 4, implicitly assuming that the range covers approximately four standard deviations.
The Role of Sample Size
The size of the sample plays a crucial role in the reliability of the Range Rule of Thumb. Generally, larger sample sizes tend to improve accuracy.
With a larger dataset, the observed range is more likely to reflect the true spread of the underlying population. Conversely, smaller samples are more susceptible to being influenced by extreme values, leading to an inaccurate estimate of the standard deviation.
The Impact of Outliers
Outliers, or extreme values that lie far from the majority of the data, can severely distort the range and, consequently, the accuracy of the Range Rule of Thumb. A single outlier can drastically inflate the range, leading to an overestimation of the standard deviation.
In datasets where outliers are present, it's essential to consider their impact and potentially remove or adjust for them before applying the rule. Robust statistical measures that are less sensitive to extreme values might be more appropriate in such cases.
The Significance of Data Shape
Beyond normality, the overall shape of the data distribution influences the validity of the Range Rule of Thumb. Key aspects to consider are symmetry and the number of peaks (modality).
Symmetrical distributions, even if not perfectly normal, tend to yield more reliable estimates compared to skewed distributions. Similarly, unimodal distributions (those with a single peak) are generally more suitable for the rule than multimodal distributions, where the presence of multiple peaks can complicate the interpretation of the range.
In summary, while the Range Rule of Thumb offers a convenient method for quickly approximating standard deviation, its accuracy is contingent upon the characteristics of the data. A normal distribution, a reasonable sample size, the absence of significant outliers, and a relatively simple data shape contribute to the rule's reliability. Recognizing these factors allows for a more informed and judicious application of this estimation technique.
Real-World Use Cases: Applications in Various Fields
Accuracy Factors: When the Rule Works Best (and When It Doesn't) The Range Rule of Thumb offers a remarkably simple approach to approximating the standard deviation of a dataset. It serves as a practical tool when a rapid, albeit less precise, understanding of data spread is required. This method is particularly valuable in scenarios where detailed calculations or complex statistical software are not immediately available.
Let's delve into several domains where this estimation method proves useful, showcasing its versatility and practicality. From education to industrial applications, the Range Rule of Thumb finds its niche in simplifying statistical assessments.
Introductory Statistics: Building Foundational Understanding
In introductory statistics courses, the Range Rule of Thumb serves as an accessible entry point to understanding the concept of standard deviation. It offers a simplified, intuitive way for students to grasp the idea of data dispersion without immediately diving into complex formulas.
By using the range, which is easily calculated, students can quickly estimate the standard deviation and relate it to the spread of data around the mean. This helps build a strong conceptual foundation before tackling more rigorous statistical methods.
The Range Rule of Thumb facilitates early comprehension and reduces initial cognitive overload.
Descriptive Statistics: Enhancing Initial Data Assessments
As a part of descriptive statistics, the Range Rule of Thumb complements other summary measures. It offers a quick, preliminary assessment of data variability that can guide further, more detailed analyses.
This initial approximation can be invaluable in the early stages of data exploration. It provides a sense of the data's spread, potentially highlighting areas that warrant closer inspection.
While not a replacement for precise calculations, it serves as a valuable first step in understanding the data's characteristics.
Quality Control: Swift Checks on Process Variation
In quality control, the Range Rule of Thumb provides a fast method to check process variation.
Engineers and technicians can rapidly estimate whether a process is operating within acceptable limits by comparing the estimated standard deviation to established control parameters.
This quick assessment can highlight potential deviations from the norm. It can serve as an early warning sign that prompts further investigation.
In settings that require constant monitoring and rapid response, such as manufacturing plants or laboratories, it offers immediate feedback without requiring elaborate statistical procedures. It allows for an efficient allocation of resources towards more detailed investigations when necessary.
Beyond the Obvious: Exploring Niche Applications
Beyond these core areas, the Range Rule of Thumb can find utility in various niche applications. This includes situations where access to technology is limited, or where immediate estimations outweigh the need for absolute precision.
It has also found utility in field research. Here, researchers can quickly estimate data spread when full statistical software is not available.
Caveats and Limitations: Knowing the Rule's Boundaries
The Range Rule of Thumb offers a remarkably simple approach to approximating the standard deviation of a dataset. It serves as a practical tool when a rapid, albeit less precise, understanding of data spread is required. This method, however, comes with inherent limitations that must be acknowledged and carefully considered.
While useful for quick estimations, it is critical to understand when and where the rule falters. Over-reliance on this method without awareness of its boundaries can lead to misleading interpretations and flawed decision-making.
Approximation, Not Precision
The most fundamental limitation of the Range Rule of Thumb is its nature as an approximation.
It is not a substitute for the more rigorous calculations provided by standard deviation formulas.
These formulas, which consider every data point in the set, offer a far more accurate reflection of the data's dispersion.
The Range Rule of Thumb, by contrast, relies solely on the difference between the maximum and minimum values. This inherently simplifies the dataset, potentially overlooking crucial nuances.
Therefore, in situations demanding precise statistical analysis, the Range Rule of Thumb should only serve as a preliminary estimate, prompting further, more detailed investigation.
The Outlier Problem
The Range Rule of Thumb is particularly susceptible to the influence of outliers.
Because the calculation hinges on the range (the difference between the highest and lowest values), extreme values can disproportionately skew the result.
Even a single outlier can dramatically inflate the range, leading to a substantial overestimation of the standard deviation.
Consider a dataset of employee salaries where most individuals earn between $50,000 and $70,000 annually, but one executive earns $500,000.
This single high value would significantly distort the range and, consequently, the estimated standard deviation derived from the Range Rule of Thumb.
In such scenarios, it is crucial to identify and address outliers before applying the rule. Consider using alternative measures of dispersion or employing data transformation techniques to mitigate the impact of extreme values.
Distribution Matters: The Normality Assumption
The accuracy of the Range Rule of Thumb is closely tied to the distribution of the data.
It performs best when the data approximates a normal distribution.
A normal distribution, characterized by its symmetrical bell shape, has predictable proportions of data falling within specific standard deviations from the mean.
The Range Rule of Thumb implicitly assumes this distribution, and its accuracy diminishes as the data deviates from normality.
In skewed distributions, where data clusters more heavily on one side of the mean, the range may not accurately reflect the typical spread of values.
For instance, in a dataset with a strong positive skew, the maximum value may be far removed from the bulk of the data, leading to an inflated range and an overestimated standard deviation.
Before applying the Range Rule of Thumb, consider evaluating the distribution of your data. Visual tools such as histograms and box plots can help assess normality.
If the data exhibits significant skewness or departures from normality, exercise caution in interpreting the results obtained from the Range Rule of Thumb.
Sample Size Considerations
While not as critical as the issues of outliers and distribution, sample size can also influence the reliability of the Range Rule of Thumb.
With very small sample sizes, the range may not adequately represent the true variability within the population.
As the sample size increases, the range is more likely to capture the full extent of the data's spread, leading to a more accurate estimation of the standard deviation.
The Range Rule of Thumb provides a rapid and intuitive method for estimating standard deviation. However, it is vital to recognize its limitations. Understanding the impact of outliers, distribution shape, and sample size is paramount to using this tool effectively and avoiding potentially misleading interpretations. In situations demanding precision or when dealing with non-normal data, more robust statistical methods should always be favored.
Video: Range Rule of Thumb: Estimate Data Spread Easily

FAQs: Range Rule of Thumb
Why would I want to quickly estimate data spread?
Quickly estimating data spread helps understand data variability. The range rule of thumb provides an easy way to approximate the standard deviation without complex calculations. This helps in initial assessments and quick comparisons.
How does the range rule of thumb work?
The range rule of thumb estimates the standard deviation by dividing the range (highest value minus lowest value) by 4. This assumes a roughly normal distribution, where most data falls within a few standard deviations of the mean.
When is the range rule of thumb NOT a good idea?
If your data is heavily skewed, has significant outliers, or isn't approximately normally distributed, the range rule of thumb can be inaccurate. It works best for relatively symmetrical, bell-shaped datasets.
Can the range rule of thumb replace calculating the actual standard deviation?
No, the range rule of thumb is a quick approximation, not a replacement for calculating the actual standard deviation. Use it for initial estimations or when exact precision is unnecessary. For serious analysis, compute the actual standard deviation.
So, there you have it! The range rule of thumb isn't a perfect science, but it's a surprisingly helpful tool for quickly understanding your data's spread. Give it a try next time you need a fast estimate—you might be surprised at how insightful this simple method can be.