Unlock Standard Deviation: Does It Even Have Units?
Standard deviation, a fundamental concept in Statistics, quantifies the dispersion within a dataset. Its calculation, often performed using tools like Excel or specialized libraries in Python, reveals the average deviation of data points from the mean. Understanding standard deviation is crucial for applications spanning from portfolio risk assessment, heavily utilized by Financial Analysts, to quality control processes in various industries. A central question arising in the application of this important statistical calculation, however, is does standard deviation have units, and what are the implications if it does or does not?
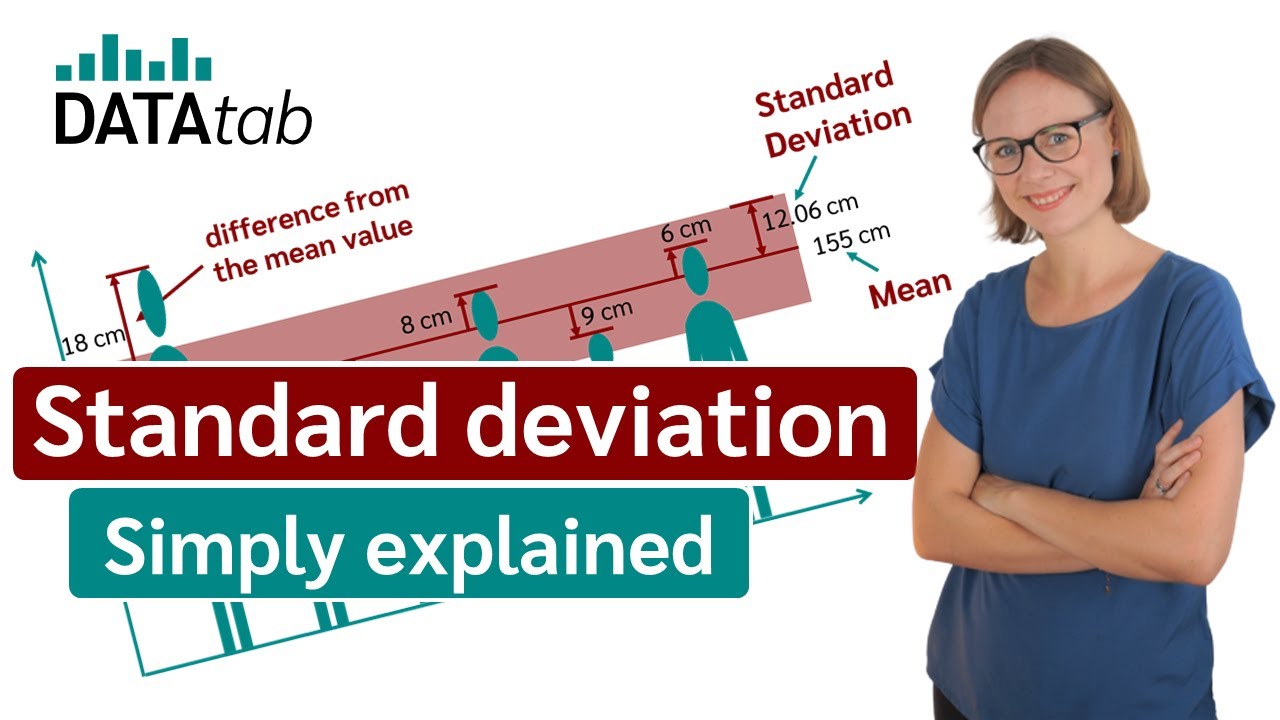
Image taken from the YouTube channel DATAtab , from the video titled Standard deviation (simply explained) .
In the realm of statistical analysis, standard deviation stands as a critical measure.
It quantifies the dispersion or spread of a dataset around its mean.
But a fundamental question often arises: Does standard deviation itself possess units of measurement?
This inquiry is far from trivial. The answer lies at the heart of accurate data interpretation and meaningful conclusions.
Standard Deviation: A Measure of Dispersion
Standard deviation, at its core, provides a single number that summarizes the variability within a set of values.
A low standard deviation indicates that data points tend to cluster closely around the mean.
Conversely, a high standard deviation suggests that data points are more widely scattered.
Its significance extends across diverse fields, from finance to healthcare, enabling analysts to understand the consistency and reliability of data.
The Central Question: Does Standard Deviation Have Units?
The concept of units is intrinsically tied to the data we analyze.
Consider measuring the heights of students in a class. The data points would be expressed in units like centimeters or inches.
Therefore, the critical question emerges: When we calculate the standard deviation of these heights, does the resulting value also carry a unit of measurement?
This seemingly simple query unlocks deeper insights into the nature of standard deviation and its proper application.
Units of Measurement: The Foundation of Meaningful Analysis
Units of measurement provide context and meaning to numerical data.
Without units, a number is simply an abstract value, devoid of real-world significance.
Whether we are dealing with currency (dollars, euros), time (seconds, hours), or physical quantities (meters, kilograms), units ground our statistical measures in reality.
Understanding the interplay between statistical measures and their associated units is paramount for informed decision-making.
The Importance of Units in Data Set Interpretation
The accurate interpretation of datasets hinges on a clear understanding of units.
Imagine a scenario where the standard deviation of product prices is calculated, but the currency is omitted.
The resulting value would be meaningless, hindering any attempt to assess price variability.
Therefore, recognizing and correctly interpreting units of measurement alongside statistical measures like standard deviation is essential for drawing valid conclusions and making sound judgments based on data.
In the realm of statistical analysis, standard deviation stands as a critical measure. It quantifies the dispersion or spread of a dataset around its mean. But a fundamental question often arises: Does standard deviation itself possess units of measurement? This inquiry is far from trivial. The answer lies at the heart of accurate data interpretation and meaningful conclusions. Standard Deviation: A Measure of Dispersion Standard deviation, at its core, provides a single number that summarizes the variability within a set of values. A low standard deviation indicates that data points tend to cluster closely around the mean. Conversely, a high standard deviation suggests that data points are more widely scattered. Its significance extends across diverse fields, from finance to healthcare, enabling analysts to understand the consistency and reliability of data. The Central Question: Does Standard Deviation Have Units? The concept of units is intrinsically tied to the data we analyze. Consider measuring the heights of students in a class. The data points would be expressed in units like centimeters or inches. Therefore, the critical question emerges: When we calculate the standard deviation of these heights, does the resulting value also carry a unit of measurement? This seemingly simple query unlocks deeper insights into the nature of standard deviation and its proper application. Units of Measurement: The Foundation of Meaningful Analysis Units of measurement provide context and meaning to numerical data. Without units, a number is simply an abstract value, devoid of real-world significance. Whether we are dealing with currency (dollars,...)
Having established the fundamental importance of units and the core question surrounding standard deviation, we now delve deeper into the mechanics of this crucial statistical measure. Understanding the definition, calculation, and relationship of standard deviation with other statistical concepts is essential before exploring the role of units in its interpretation.
Decoding Standard Deviation: Definition and Calculation
Standard deviation is a cornerstone of statistical analysis. It is essential for understanding the spread of data. A thorough grasp of its definition and calculation is paramount.
What is Standard Deviation? A Formal Definition
Formally, the standard deviation is a measure that quantifies the amount of variation or dispersion of a set of data values. A low standard deviation signifies that the data points tend to be close to the mean (or average) of the set. Conversely, a high standard deviation indicates that the data points are spread out over a wider range of values.
It is often represented by the Greek letter sigma (σ) for a population. It is represented by 's' for a sample. This distinction is important in inferential statistics.
The Interplay Between Standard Deviation and Variance
The standard deviation is intrinsically linked to the concept of variance. Variance measures the average squared deviation from the mean. To calculate variance, each data point's deviation from the mean is squared, and then these squared deviations are averaged.
The squaring is crucial. It ensures that deviations below and above the mean contribute positively to the overall measure of spread.
Standard deviation, essentially, is the square root of the variance.
Taking the square root transforms the variance back into the original units of measurement. This makes standard deviation more interpretable and directly comparable to the original data.
Standard Deviation in Relation to the Mean
Standard deviation provides context to the mean. The mean represents the "typical" value in a dataset. Standard deviation tells us how much the data deviates from that typical value on average.
Together, the mean and standard deviation offer a concise summary of a dataset's central tendency and variability. For instance, consider a dataset of test scores with a mean of 75 and a standard deviation of 10. This suggests that, on average, scores deviate by 10 points from the average score of 75.
Real-World Examples: Calculating and Interpreting Standard Deviation
Let’s solidify our understanding with some real-world examples.
Example 1: Stock Prices
Consider a dataset of daily closing prices for a particular stock over a month. Suppose after calculation, we find the mean price to be $50, and the standard deviation to be $5. This implies that the stock price typically fluctuates around $50, with an average deviation of $5. A higher standard deviation here would indicate greater volatility and risk.
Example 2: Manufacturing Quality Control
In a manufacturing plant, the diameter of produced bolts is a critical parameter. A dataset of bolt diameters yields a mean of 10 mm and a standard deviation of 0.1 mm.
The small standard deviation indicates high consistency in the manufacturing process. It means most bolts are very close to the target diameter. Larger standard deviations would warrant investigation and process adjustments.
By calculating and interpreting the standard deviation in these examples, you can gain tangible insights into data dispersion. The insights will help to make informed decisions across various fields.
In the realm of statistical analysis, standard deviation stands as a critical measure. It quantifies the dispersion or spread of a dataset around its mean. But a fundamental question often arises: Does standard deviation itself possess units of measurement? This inquiry is far from trivial. The answer lies at the heart of accurate data interpretation and meaningful conclusions. Standard deviation, at its core, provides a single number that summarizes the variability within a set of values. A low standard deviation indicates that data points tend to cluster closely around the mean. Conversely, a high standard deviation suggests that data points are more widely scattered. Its significance extends across diverse fields, from finance to healthcare, enabling analysts to understand the consistency and reliability of data. The concept of units is intrinsically tied to the data we analyze. Consider measuring the heights of students in a class. The data points would be expressed in units like centimeters or inches. Therefore, the critical question emerges: When we calculate the standard deviation of these heights, does the resulting value also carry a unit of measurement? This seemingly simple query unlocks deeper insights into the nature of standard deviation and its proper application. Whether we are dealing with currency (dollars, euros), time (seconds, minutes), or physical dimensions (meters, feet), units ground our data in reality.
Building upon the understanding of standard deviation and its importance, we now turn our attention to the bedrock upon which all quantitative analysis is built: units of measurement. Without a firm grasp of units, we risk misinterpreting data and drawing inaccurate conclusions, regardless of how sophisticated our statistical techniques may be. Let's explore why understanding units is so crucial.
The Foundation: Understanding Units of Measurement
Units of measurement are the essential language through which we describe and quantify the world around us. They provide context and meaning to numerical values, transforming abstract numbers into tangible realities. In scientific and analytical fields, units are indispensable for accurate communication, experimentation, and data interpretation.
Defining Units of Measurement
A unit of measurement is a standard quantity used to express the magnitude of a physical quantity. It provides a reference point, allowing us to compare and quantify different amounts of the same property.
For example, the meter is a unit of length, the second is a unit of time, and the kilogram is a unit of mass.
The choice of units depends on the specific context and the nature of the quantity being measured. These choices must be consistent and clearly defined to ensure accuracy and reproducibility in scientific and analytical work.
The Critical Role of Units
The importance of units of measurement cannot be overstated. They are the foundation upon which scientific and analytical reasoning is built. Without units, numbers are simply abstract values, devoid of real-world meaning.
Units enable us to:
- Quantify observations: Assign numerical values to physical quantities, making them measurable and comparable.
- Communicate effectively: Ensure that measurements are understood consistently across different individuals and contexts.
- Perform calculations: Allow us to manipulate and combine measurements mathematically to derive new information.
- Validate results: Provide a means of verifying the accuracy and consistency of experimental findings.
Neglecting units can lead to severe errors and misinterpretations in scientific and analytical endeavors. Imagine a scenario where a medication dosage is prescribed without specifying the units (e.g., milligrams vs. grams). Such an oversight could have life-threatening consequences.
Units in Raw Data and Datasets
In the realm of data analysis, units are intrinsically linked to raw data and datasets. Each data point within a dataset represents a measurement of a specific property, and that measurement must be associated with a corresponding unit.
Consider a dataset containing the weights of apples in an orchard. Each data point would represent the weight of a single apple, expressed in units such as grams or ounces. The units provide context, allowing us to understand the scale and magnitude of the data.
Units are not optional; they are an integral part of the data.
Omitting units from a dataset renders the data meaningless and prevents any meaningful analysis or interpretation. It is crucial to ensure that all raw data is properly labeled with appropriate units before proceeding with any statistical or analytical procedures.
Data Points and Inherent Units
Each individual data point inherently possesses a unit of measurement. This unit defines what the number represents in the real world.
Consider these examples:
- 5 meters: The unit "meters" indicates that the number 5 represents a length or distance.
- 25 degrees Celsius: The unit "degrees Celsius" specifies that the number 25 represents a temperature measurement.
- 100 US dollars: The unit "US dollars" denotes that the number 100 represents a monetary value.
The unit transforms the abstract number into a concrete representation of a measurable quantity. Without the unit, the number loses its meaning and becomes an arbitrary value.
Therefore, it is imperative to recognize and acknowledge the units associated with each data point. This understanding is essential for accurate data interpretation and analysis, and it forms the basis for understanding the units of standard deviation.
Building upon the understanding of standard deviation and its importance, we now turn our attention to the bedrock upon which all quantitative analysis is built: units of measurement. Without a firm grasp of these fundamental building blocks, even the most sophisticated statistical techniques can yield meaningless or, worse, misleading results. It's time to dissect the standard deviation formula and expose how it elegantly carries forward the units of the original data.
A Deep Dive: Unraveling the Units of Standard Deviation
The standard deviation, at first glance, might seem like an abstract statistical construct. However, a closer examination reveals its profound connection to the units in which the original data is expressed. Understanding this connection is not just a matter of academic curiosity; it's a critical skill for anyone who works with data.
Deconstructing the Formula: The Genesis of Units
The formula for standard deviation involves calculating the deviations from the mean, squaring those deviations, averaging them (variance), and then taking the square root of that average. Let's break down how the units behave at each step:
-
Deviation from the Mean: We begin by subtracting the mean from each data point. Since both the data points and the mean are expressed in the same units, the resulting deviations also retain those units. For example, if we're analyzing heights in centimeters, the deviations will also be in centimeters.
-
Squaring the Deviations: This is where things get interesting. When we square the deviations, we're also squaring the units. So, if our original data was in centimeters, the squared deviations will be in square centimeters (cm2). This is why variance is expressed in squared units.
-
Averaging (Calculating Variance): Averaging the squared deviations doesn't change the units. We're simply summing values in square centimeters and dividing by the number of values. The result, variance, remains in square centimeters.
-
Taking the Square Root: Finally, we take the square root of the variance to obtain the standard deviation. This is the crucial step that brings the units back to their original form. The square root of square centimeters (cm2) is simply centimeters (cm).
Therefore, the standard deviation inherits the units of the original data because of this final square root operation, effectively reversing the squaring that occurred earlier in the calculation.
Inheritance Explained: Why Standard Deviation Carries the Units
The reason standard deviation inherits the units stems directly from its purpose: to provide a measure of spread in the same terms as the original data. If we were to report standard deviation in squared units, it would be difficult to relate it back to the original data points and their distribution.
By taking the square root of the variance, we ensure that the standard deviation is expressed in the same units as the mean and the individual data points. This allows for direct comparison and meaningful interpretation. Imagine comparing a standard deviation of 5 cm to a mean height of 170 cm; the shared unit provides immediate context.
The Crucial Role of Units: Examples in Interpretation
Understanding the units of standard deviation is not just about theoretical correctness; it's essential for accurate interpretation and informed decision-making. Consider these examples:
-
Financial Analysis (Dollars): If you're analyzing the daily stock price fluctuations of a company, the standard deviation will be expressed in dollars. A higher standard deviation indicates greater volatility, meaning the stock price tends to fluctuate more widely each day. Understanding this in dollar terms is crucial for risk assessment.
-
Manufacturing (Meters): In a manufacturing process, if you're measuring the length of a component, the standard deviation will be expressed in meters (or millimeters, etc.). A small standard deviation indicates high precision and consistency in the manufacturing process, with components consistently close to the target length.
-
Scientific Research (Seconds): If you're measuring the reaction time of participants in an experiment, the standard deviation will be in seconds. A lower standard deviation suggests more consistent reaction times across the group, indicating a more reliable effect.
In each of these examples, the units provide critical context for interpreting the standard deviation and drawing meaningful conclusions. Without understanding the units, it would be impossible to assess the practical significance of the calculated value.
Diverse Data Sets: A Kaleidoscope of Units
The beauty of standard deviation lies in its applicability across a wide range of data types, each with its own corresponding units of measurement. Here are just a few examples:
- Time: Measured in seconds, minutes, hours, days, years, etc.
- Currency: Measured in dollars, euros, yen, pounds, etc.
- Distance: Measured in meters, feet, miles, kilometers, etc.
- Weight: Measured in kilograms, pounds, grams, ounces, etc.
- Temperature: Measured in Celsius, Fahrenheit, Kelvin, etc.
- Pressure: Measured in Pascals, atmospheres, psi, etc.
The key takeaway is that the units of the standard deviation will always match the units of the data being analyzed. Recognizing and correctly interpreting these units is paramount for accurate data analysis and informed decision-making. Failing to do so can lead to misinterpretations and flawed conclusions.
Building upon the understanding of standard deviation and its importance, we now turn our attention to the bedrock upon which all quantitative analysis is built: units of measurement. Without a firm grasp of these fundamental building blocks, even the most sophisticated statistical techniques can yield meaningless or, worse, misleading results. It's time to dissect the standard deviation formula and expose how it elegantly carries forward the units of the original data.
Population vs. Sample: Units in Different Contexts
While the underlying principle of standard deviation remains the same, the subtle nuances in its calculation for populations versus samples often create confusion. This section clarifies these differences, reaffirming that regardless of the specific formula used, the standard deviation consistently inherits the units of the original data. Understanding this is crucial for accurate interpretation and avoids potential misapplications of the statistic.
Population Standard Deviation: A Complete Perspective
The population standard deviation aims to capture the variability within an entire group. It's calculated using every single data point in the population.
The formula differs slightly from the sample standard deviation, primarily in the denominator. It uses 'N' (the total number of individuals in the population) instead of 'n-1'.
Sample Standard Deviation: Estimating from a Subset
In many real-world scenarios, gathering data from an entire population is impractical or impossible.
Instead, we rely on samples – smaller, representative subsets of the population. The sample standard deviation is an estimate of the population standard deviation, calculated from this sample data.
The key difference lies in the denominator: 'n-1' (where 'n' is the sample size), also known as Bessel's correction. This adjustment accounts for the fact that a sample is likely to underestimate the true population variability.
The Formula: A Tale of Two Denominators
The slight variation in the formula – using 'N' for populations and 'n-1' for samples – is crucial for statistical accuracy, especially when dealing with smaller sample sizes.
Ignoring this difference can lead to biased estimates of the population standard deviation. However, this difference doesn't impact the units of standard deviation.
Units Remain Consistent: The Inherent Link
Despite the difference in calculation, both population and sample standard deviations inherit the units of the original data. The fundamental operations within the formula—subtraction, squaring, summing, and taking the square root—preserve the original units.
If your data is in meters, both the population and sample standard deviations will also be in meters.
Recognizing the Source: Population or Sample
Accurately identifying whether your data represents a population or a sample is paramount. This decision directly impacts the formula you use and, consequently, the accuracy of your statistical inferences.
Misinterpreting a sample as a population, or vice versa, can lead to flawed analyses and incorrect conclusions.
Consider the context of your data collection and carefully define the scope of your analysis. Are you working with the entire population or a representative subset? This understanding is foundational for applying the correct statistical tools and interpreting the results effectively.
Building on our exploration of standard deviation and units, it's time to examine their practical applications in statistical and data analysis. Understanding how these elements work together is critical for drawing meaningful insights from data. This section illuminates the crucial role of units in ensuring the accuracy and relevance of statistical findings across diverse fields.
Units in Action: Statistical and Data Analysis Applications
The Indispensable Role of Units in Statistical Analysis
Units of measurement are not mere afterthoughts in statistical analysis; they are foundational elements that dictate the validity and interpretability of results. When calculating standard deviation, retaining the appropriate units is paramount. Failing to do so can lead to absurd or misleading conclusions. Imagine calculating the standard deviation of heights in centimeters but reporting the result without specifying the unit. The numerical value alone is meaningless without context.
The standard deviation's units directly reflect the variability inherent in the original data. If the data represents time in seconds, the standard deviation will be in seconds, providing a measure of the typical deviation from the average time. This understanding is crucial for making informed decisions based on statistical analysis.
Standard Deviation and Units: A Symphony Across Fields
The interplay between standard deviation and units of measurement is evident across various disciplines. Let's consider a few examples:
-
Finance: In finance, standard deviation is often used to measure the volatility of investment returns. If returns are measured in percentage points, the standard deviation will also be in percentage points, indicating the range within which returns typically fluctuate. This allows investors to assess risk in a tangible and understandable way.
-
Engineering: Engineers frequently use standard deviation to assess the consistency of manufacturing processes. If a machine produces parts with lengths measured in millimeters, the standard deviation will also be in millimeters, providing a measure of the variation in part lengths. This information is vital for quality control and ensuring that parts meet specified tolerances.
-
Healthcare: In healthcare, standard deviation can be used to analyze patient vital signs such as blood pressure or heart rate. If blood pressure is measured in millimeters of mercury (mmHg), the standard deviation will also be in mmHg, indicating the typical variation in blood pressure readings. This information can help healthcare professionals identify patients who may be at risk of developing certain health conditions.
-
Environmental Science: Environmental scientists might measure pollutant concentrations in parts per million (ppm). The standard deviation, also in ppm, would then describe the variability of pollutant levels, helping to assess environmental quality and compliance with regulations.
In each of these examples, the units provide critical context for interpreting the standard deviation. Without understanding the units, it's impossible to fully grasp the implications of the statistical analysis.
Clarity is Key: Labeling and Representation in Statistical Reports
The importance of units extends beyond calculation; it's equally crucial to ensure clear labeling and accurate representation of units in statistical reports and visualizations. Every table, graph, and chart should explicitly state the units of measurement used. This eliminates ambiguity and allows readers to correctly interpret the data.
For example, when presenting a graph showing the distribution of test scores, the y-axis should clearly indicate whether the scores are raw points, percentages, or some other standardized measure. Similarly, in a table summarizing the results of a clinical trial, the units of measurement for each variable (e.g., mg/dL for blood glucose, bpm for heart rate) should be clearly stated in the column headings or footnotes.
Visualizations should always include clear axis labels that specify the units of measurement. This includes scatter plots, histograms, box plots, and other types of graphs. In the absence of clear labeling, even the most sophisticated statistical analysis can be rendered useless. The goal is to communicate findings in a clear, concise, and unambiguous manner, and proper attention to units is essential for achieving this.
By consistently emphasizing the units of measurement, we ensure that statistical analyses are not only accurate but also meaningful and easily understood by a wide audience. This practice fosters transparency and promotes informed decision-making across all fields.
Video: Unlock Standard Deviation: Does It Even Have Units?

FAQs: Standard Deviation Units Explained
This FAQ section addresses common questions about standard deviation and its units, clarifying how they relate to the data being analyzed.
What does it mean when you say standard deviation has units?
When we say standard deviation has units, it means the units of the standard deviation are the same as the units of the original data. So, if your data is in meters, the standard deviation is also in meters. The process of calculating standard deviation, involving differences and averaging, preserves the original units.
Why is it important that the standard deviation does have units?
Because the standard deviation does have units, it allows for meaningful comparisons and interpretations within the context of the original data. We can understand the spread or variability in terms of those units, like dollars, kilograms, or degrees Celsius. Without the correct units, our understanding of the variability becomes abstract and less practical.
If variance is squared, why does standard deviation have units and not squared units?
Variance does have squared units because it's calculated using squared differences. Standard deviation is the square root of the variance, which cancels out the squaring and returns the measure to the original units of the data. This is essential for practical interpretation; understanding variation in squared units is rarely intuitive. So, while the variance has squared units, the standard deviation does have units equivalent to the original data.
Can a standard deviation have different units than the original data?
No, the standard deviation cannot have different units than the original data it describes. The calculations performed in determining the standard deviation maintain the original unit of measurement. If the standard deviation has a different unit, something is wrong with the calculation or interpretation.