TTT Diagram Demystified: Master Time-Temperature-Transformation
Understanding the intricacies of phase transformations in materials science is crucial for optimizing industrial processes like steel manufacturing. The American Society for Metals (ASM), a leading authority in materials engineering, emphasizes the importance of predicting microstructural evolution using tools such as the JMatPro software. This article focuses on the core principle behind such predictions: the ttt diagram, and offers a comprehensive exploration of Time-Temperature-Transformation diagrams to achieve mastery in controlling material properties.
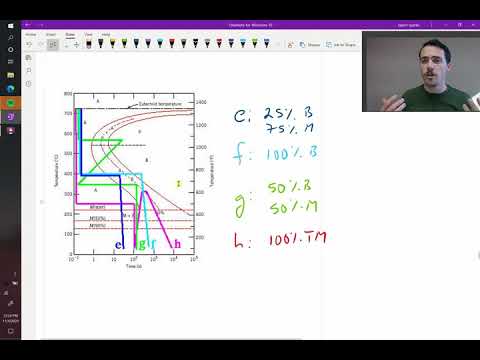
Image taken from the YouTube channel Taylor Sparks , from the video titled Examples of steel microstructures using a TTT diagram .
Imagine crafting materials with properties tailored to specific applications – stronger, more durable, more resistant to wear. The secret to this lies in understanding and controlling the microstructure of materials through carefully designed heat treatments. Time-Temperature-Transformation (TTT) diagrams are the cornerstone of this process, offering a roadmap for achieving desired material characteristics.
The Power of Precise Heat Treatment: A Metallurgical Symphony
Heat treatment is not merely about heating and cooling a material. It's a precise metallurgical symphony where temperature and time are the key instruments. By orchestrating these parameters, engineers can induce phase transformations that dramatically alter a material's properties.
This control unlocks the potential to optimize materials for everything from high-strength aircraft components to corrosion-resistant pipelines. The TTT diagram is the score that guides this performance, allowing us to predict and control the resulting microstructure.
What is a TTT Diagram (Time-Temperature-Transformation Diagram)? A Definition
The Time-Temperature-Transformation (TTT) diagram, also known as an isothermal transformation diagram, is a graphical representation of the phase transformations in a material at constant temperature. It plots temperature against time (usually on a logarithmic scale) and indicates the start and finish times for the transformation of austenite into other microconstituents like pearlite, bainite, and martensite.
Essentially, it's a map that shows how the microstructure of a material changes over time at different temperatures. Each curve on the diagram represents the beginning or end of a specific phase transformation.
Importance of Understanding TTT Diagrams in Materials Science, Metallurgy, and Engineering
TTT diagrams are essential tools for materials scientists, metallurgists, and engineers because they provide invaluable insights into the behavior of materials during heat treatment.
-
Predicting Microstructures: TTT diagrams enable us to predict the resulting microstructure after a specific heat treatment process.
-
Designing Heat Treatments: They help in designing heat treatment cycles to achieve desired mechanical properties.
-
Optimizing Material Performance: By controlling the microstructure, we can optimize material performance for specific applications.
-
Quality Control: TTT diagrams also play a vital role in quality control, ensuring that materials meet required specifications.
Article Overview: What You'll Learn
In this article, we will delve into the world of TTT diagrams, exploring their fundamental principles, interpreting their features, and understanding their practical applications.
We will cover the science behind phase transformations, provide a step-by-step guide to reading and interpreting TTT diagrams, and discuss the factors that influence their shape and position. Furthermore, we will explore the use of TTT diagrams in designing heat treatment processes and compare them with Continuous Cooling Transformation (CCT) diagrams. Finally, we will address the limitations of TTT diagrams to provide a comprehensive understanding of these powerful tools.
Imagine crafting materials with properties tailored to specific applications – stronger, more durable, more resistant to wear. The secret to this lies in understanding and controlling the microstructure of materials through carefully designed heat treatments. Time-Temperature-Transformation (TTT) diagrams are the cornerstone of this process, offering a roadmap for achieving desired material characteristics.
What’s happening at the atomic level to cause these dramatic shifts in material behavior? To truly harness the power of TTT diagrams, we must first delve into the science that underpins them: the fascinating world of phase transformations.
The Science Behind Phase Transformations
At its core, a phase transformation represents a change in the physical structure or composition of a material. This change occurs as the material seeks to reach a state of lower free energy. It's like a ball rolling downhill.
These transformations are fundamental to materials science, dictating a material's properties and behavior. They allow us to tailor materials for specific applications, optimizing performance in diverse environments.
Defining Phase Transformation in Materials
A phase transformation is defined as an alteration in the microstructure of a material. This occurs due to changes in temperature, pressure, or composition.
Think of water transforming into ice. The chemical composition (H₂O) remains the same, but the arrangement of molecules changes, resulting in a different phase with distinct properties.
In metals, phase transformations involve changes in the crystal structure or the arrangement of different elements within the alloy.
These changes can dramatically alter mechanical properties like strength, hardness, and ductility.
The Role of Temperature and Time in Phase Transformations
Temperature and time are the two primary drivers of phase transformations. Temperature provides the energy needed for atoms to move and rearrange themselves. Time provides the opportunity for the transformation to progress.
At a specific temperature, a material may exist in a metastable state, meaning it's not in its lowest energy configuration but is stuck there due to kinetic barriers.
Increasing the temperature provides the energy to overcome these barriers, allowing the material to transition to a more stable phase.
However, temperature alone is not enough. The transformation also requires time. Atoms don't instantaneously rearrange themselves.
The rate of transformation depends on the temperature and the energy barrier that needs to be overcome. This interplay between temperature and time is precisely what the TTT diagram captures.
Relationship between TTT Diagram and Isothermal Transformation Diagram
TTT diagrams are often referred to as isothermal transformation diagrams. This is because they depict transformations occurring at a constant temperature (isothermal conditions).
The 'T' in TTT stands for Temperature, reflecting the diagram's focus on isothermal conditions.
Each curve on the TTT diagram represents the start or finish of a specific phase transformation at a given temperature.
By holding a material at a constant temperature, we can track the progression of phase transformation over time. We can then plot this progression on the diagram.
These isothermal conditions provide a simplified view of transformation kinetics. This allows us to predict microstructures under specific heat treatment conditions.
The Significance of Cooling Rate
While TTT diagrams focus on isothermal transformations, real-world heat treatments often involve continuous cooling. This is where the cooling rate becomes a critical factor.
The cooling rate describes how quickly a material is cooled from a high temperature.
Different cooling rates can lead to different microstructures, even for the same material.
A rapid cooling rate can suppress the formation of equilibrium phases. It favors the formation of non-equilibrium phases like martensite. Slower cooling rates allow for the formation of more stable phases like pearlite.
Therefore, understanding the cooling rate is essential for predicting the final microstructure. This is particularly important when applying TTT diagrams to practical heat treatment processes.
Imagine crafting materials with properties tailored to specific applications – stronger, more durable, more resistant to wear. The secret to this lies in understanding and controlling the microstructure of materials through carefully designed heat treatments. Time-Temperature-Transformation (TTT) diagrams are the cornerstone of this process, offering a roadmap for achieving desired material characteristics.
What’s happening at the atomic level to cause these dramatic shifts in material behavior? To truly harness the power of TTT diagrams, we must first delve into the science that underpins them: the fascinating world of phase transformations.
Decoding the TTT Diagram: A Step-by-Step Guide
TTT diagrams might appear complex at first glance, but with a systematic approach, you can unlock their full potential. This section provides a detailed guide to reading and interpreting these essential tools for materials engineers and metallurgists.
We will explore each component of the diagram, from the axes to the various microconstituents, and demonstrate how to predict microstructures based on different cooling paths.
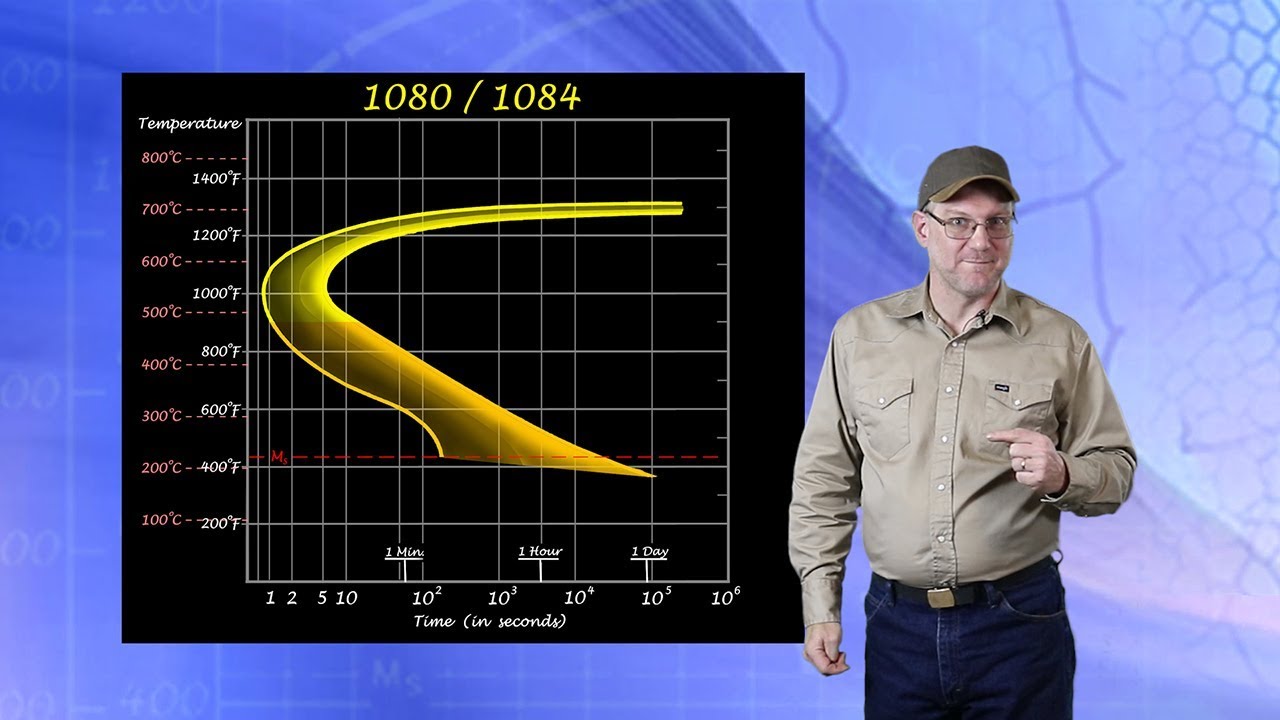
Understanding the Axes: Time and Temperature
The TTT diagram plots temperature on the vertical axis and time (usually on a logarithmic scale) on the horizontal axis.
Temperature typically ranges from above the austenitic temperature down to room temperature.
Time represents the duration for which the material is held at a specific temperature. This time scale is crucial because it dictates the rate at which phase transformations occur. The use of a logarithmic scale allows for a broad range of times to be displayed, capturing both rapid and slow transformations.
Key Microconstituents: The Building Blocks of Steel
The curves within a TTT diagram delineate the start and finish times for the formation of different microconstituents. The most common microconstituents in steel are austenite, martensite, bainite, pearlite, ferrite, and cementite. Each microconstituent imparts unique properties to the material.
Austenite: The Starting Point
Austenite is a high-temperature phase of iron characterized by its face-centered cubic (FCC) crystal structure.
It is the starting point for most heat treatment processes applied to steel.
The goal of many heat treatments is to transform austenite into other, more desirable microconstituents by controlled cooling.
Martensite: The Hardest Transformation
Martensite is formed by a rapid, diffusionless transformation of austenite.
This occurs when the steel is cooled very quickly (quenched). This traps carbon atoms within the iron lattice, resulting in extreme hardness but also brittleness.
Martensite is not an equilibrium phase and requires tempering to improve its ductility.
Bainite: An Alternative to Martensite
Bainite is a microconstituent that forms at temperatures between those for pearlite and martensite. It exhibits a needle-like or feathery microstructure.
Bainite offers a good combination of strength and toughness, making it a desirable alternative to martensite in certain applications.
Pearlite: A Common Microconstituent
Pearlite is a eutectoid mixture of ferrite and cementite.
It forms at relatively high temperatures and slower cooling rates.
Pearlite has a characteristic lamellar (layered) structure, offering a balance of strength and ductility.
Ferrite
Ferrite is a solid solution of carbon in body-centered cubic (BCC) iron. It is relatively soft and ductile.
Cementite
Cementite (Fe3C) is an iron carbide. It's extremely hard and brittle and is found in many steels as a component of pearlite or in other more complex carbides.
Reading the Curves: Identifying Transformation Start and Finish Times
The curves on a TTT diagram indicate the times at which phase transformations begin and end at a given temperature.
The "nose" of the TTT diagram, often representing the fastest transformation rate, is a crucial point.
Cooling curves that pass to the left of the nose will result in different microstructures than those that pass to the right.
By tracing a horizontal line at a specific temperature, you can determine the time required for the transformation to start and finish. These curves allow engineers to predict the resulting microstructure based on the time and temperature profile of a heat treatment.
Interpreting Microstructures Based on Cooling Paths
The real power of TTT diagrams lies in their ability to predict the microstructure resulting from a specific cooling path.
By superimposing a cooling curve onto the TTT diagram, you can determine which phase transformations will occur. If the cooling curve intersects a transformation curve, the corresponding microconstituent will form.
The fraction of each microconstituent can be estimated based on the relative amounts of time spent in different transformation regions. For example, rapid quenching can avoid the formation of pearlite and bainite, leading to a fully martensitic structure.
The final microstructure dictates the material's properties. Careful selection of the cooling path allows you to tailor the material's hardness, strength, ductility, and toughness to meet the demands of its intended application.
Imagine crafting materials with properties tailored to specific applications – stronger, more durable, more resistant to wear. The secret to this lies in understanding and controlling the microstructure of materials through carefully designed heat treatments. Time-Temperature-Transformation (TTT) diagrams are the cornerstone of this process, offering a roadmap for achieving desired material characteristics.
What’s happening at the atomic level to cause these dramatic shifts in material behavior? To truly harness the power of TTT diagrams, we must first delve into the science that underpins them: the fascinating world of phase transformations.
Factors Influencing the TTT Diagram
TTT diagrams are powerful tools, but it's crucial to recognize that they aren't universally applicable, nor are they static representations. Several factors can significantly alter the shape, position, and overall behavior depicted in a TTT diagram for a specific material.
These factors include the chemical composition of the material, the austenitic grain size, and any prior cold work performed on the material. Understanding these influences is paramount for accurate interpretation and effective application of TTT diagrams in real-world scenarios.
The Impact of Chemical Composition
The chemical composition of a material, particularly in steels and alloys, exerts a profound influence on its TTT diagram. Even minor variations in alloying elements can shift the transformation curves, affecting the kinetics of phase transformations.
Alloying elements can either accelerate or retard the transformation process, depending on their specific interaction with the base metal.
Steel and Alloying Elements
In steel, the addition of alloying elements like chromium, nickel, molybdenum, and manganese can significantly alter the position of the TTT curves. These elements generally shift the curves to the right, increasing the hardenability of the steel.
Hardenability refers to the steel's ability to form martensite upon quenching. Alloying elements achieve this by slowing down the diffusion-controlled transformations like pearlite and bainite formation, allowing martensite formation to occur more readily.
For instance, chromium is a strong carbide former. It can stabilize carbides and influence the morphology and distribution of these carbides within the microstructure. Nickel, on the other hand, stabilizes the austenite phase and promotes its retention at lower temperatures, delaying the start of transformations.
Beyond Steel: Alloy Considerations
The effects of chemical composition extend beyond steel. In aluminum alloys, for example, the addition of elements like copper, magnesium, and silicon can lead to the formation of various intermetallic compounds. These intermetallic compounds influence the precipitation hardening behavior of the alloy.
The type, size, and distribution of these precipitates are highly dependent on the alloy composition and the thermal history, which are directly linked to the TTT diagram.
The Role of Austenitic Grain Size
The grain size of austenite, the high-temperature face-centered cubic (FCC) phase of steel, has a considerable impact on the kinetics of phase transformations during cooling.
A smaller austenitic grain size generally promotes faster transformation kinetics. This is primarily because grain boundaries act as nucleation sites for new phases. A larger number of grain boundaries in a fine-grained austenite provides more locations for pearlite, bainite, and ferrite to form.
Conversely, a coarser austenitic grain size reduces the number of nucleation sites, slowing down the transformation process and shifting the TTT curves to longer times. Consequently, steels with coarser grain sizes exhibit higher hardenability because they are more prone to martensite formation.
Influence of Prior Cold Work
Cold work, which involves plastic deformation at temperatures below the recrystallization temperature, introduces various defects into the material's microstructure, such as dislocations and point defects.
These defects act as nucleation sites for phase transformations, similar to grain boundaries. Therefore, prior cold work can accelerate the transformation kinetics and shift the TTT curves to shorter times.
The amount and type of cold work significantly affect the magnitude of this influence. Heavy cold work introduces a higher density of defects, leading to a more pronounced acceleration of phase transformations.
The addition of alloying elements, therefore, necessitates a careful consideration of their impact on the TTT diagram. By meticulously analyzing the shifted curves, engineers can fine-tune heat treatments to achieve the precise microstructures required for their specific application. This level of control is paramount in ensuring the optimal performance and longevity of materials in demanding environments.
Applications of TTT Diagrams in Heat Treatment Processes
TTT diagrams aren't just theoretical constructs; they are indispensable tools that bridge the gap between materials science and practical engineering. Their true power lies in their ability to guide the design and control of heat treatment processes, enabling the prediction of microstructures and the attainment of desired material properties.
Predicting Microstructures: A Roadmap for Material Transformation
The primary application of TTT diagrams is predicting the resulting microstructure after subjecting a material to a specific heat treatment. By mapping the temperature-time path onto the TTT diagram, one can determine which phases will form and in what proportions.
This predictive capability is invaluable for tailoring materials to meet specific performance criteria.
For example, if high strength is desired, the TTT diagram can be used to design a heat treatment that promotes the formation of martensite. Conversely, if improved ductility is the goal, the diagram can guide the selection of a process that yields a softer, more ductile microstructure like ferrite.
Designing Heat Treatments: Tailoring Material Properties
Beyond mere prediction, TTT diagrams empower engineers to design purpose-built heat treatment processes. This design process involves carefully selecting the heating temperature, holding time, and cooling rate to achieve the desired microstructure.
Imagine the challenge of creating a gear that needs a hard, wear-resistant surface and a tough, shock-resistant core. By using TTT diagrams, engineers can design a case hardening process that transforms the surface layer into martensite while leaving the core with a more ductile microstructure.
This level of control is critical in optimizing material performance for specific applications.
Specific Heat Treatment Examples: Quenching, Tempering, and Annealing
Let's examine some common heat treatment processes and how TTT diagrams are used to optimize them:
Quenching to Form Martensite
Quenching involves rapidly cooling a material from a high temperature to avoid the formation of softer phases like pearlite and bainite, instead encouraging the formation of martensite. The TTT diagram is used to determine the critical cooling rate needed to bypass the "nose" of the curve and ensure a fully martensitic structure.
Tempering of Martensite
While martensite is exceptionally hard, it's also brittle. Tempering involves reheating the quenched material to a lower temperature to reduce its brittleness without significantly sacrificing its hardness. The TTT diagram helps determine the optimal tempering temperature and time to achieve the desired balance of hardness and toughness.
Annealing for Softening
Annealing is a heat treatment used to soften a material, relieve internal stresses, and improve ductility. The TTT diagram guides the selection of annealing temperatures and holding times to allow the formation of softer phases like ferrite and pearlite.
Influence on Mechanical Properties: Hardness, Strength, and Ductility
The ultimate goal of heat treatment is to modify the mechanical properties of a material to suit its intended application. TTT diagrams provide a clear understanding of how different microstructures influence properties such as:
Hardness
Martensite is the hardest microstructure, while ferrite is the softest. TTT diagrams enable the design of heat treatments to achieve the desired hardness level.
Tensile Strength and Yield Strength
The strength of a material is directly related to its microstructure. By controlling the phase transformations, TTT diagrams facilitate the tailoring of tensile and yield strengths.
Ductility
Ductility, the ability of a material to deform without fracturing, is inversely related to hardness and strength. Annealing and tempering processes guided by TTT diagrams can enhance ductility.
In conclusion, TTT diagrams are much more than just academic curiosities. They serve as the bedrock for the design and control of heat treatment processes, allowing engineers to precisely tailor the mechanical properties of materials to meet the demands of a wide array of applications. By understanding and applying the principles embedded within these diagrams, we can unlock the full potential of materials and create stronger, more durable, and more reliable products.
TTT diagrams are powerful tools for understanding phase transformations under isothermal conditions. But real-world heat treatments rarely involve holding a material at a constant temperature. Instead, materials are typically cooled continuously. This is where Continuous Cooling Transformation (CCT) diagrams come into play, offering a more realistic representation of microstructural evolution during typical processing.
TTT vs. CCT Diagrams: Understanding the Differences
While TTT diagrams provide a fundamental understanding of phase transformations, they are based on an idealized scenario. CCT diagrams are specifically designed to address the limitations of TTT diagrams by accounting for the continuous cooling process that occurs in most practical heat treatments. Understanding the nuances between these two types of diagrams is crucial for selecting the appropriate tool for a given application.
Comparing Isothermal (TTT) and Continuous Cooling (CCT) Transformations
The core difference lies in the cooling path. TTT diagrams, also known as isothermal transformation diagrams, depict transformations that occur at a constant temperature over time. A sample is rapidly quenched to a specific temperature and held there until the transformation is complete.
In contrast, CCT diagrams illustrate transformations that occur during continuous cooling from a specific austenitizing temperature. The cooling rate is varied, and the resulting microstructures are mapped onto the diagram.
This difference in cooling path leads to several key distinctions in the diagrams themselves. CCT curves are generally shifted downward and to the right compared to TTT curves. This is because continuous cooling suppresses the start of phase transformations, requiring lower temperatures and longer times for nucleation and growth to occur.
Additionally, the shape of the curves differs. TTT diagrams typically exhibit a "C" shape, representing the characteristic nose of the transformation curve. CCT diagrams, however, may show more complex shapes, influenced by the continuously changing temperature.
When to Use Each Diagram
The choice between using a TTT or CCT diagram depends on the specific application and the type of heat treatment being considered.
TTT diagrams are most useful for:
- Understanding the fundamental kinetics of phase transformations.
- Designing heat treatments that involve isothermal holding, such as austempering or martempering.
- Educational purposes, to illustrate the basic principles of phase transformations.
CCT diagrams are more appropriate for:
- Simulating real-world heat treatment processes involving continuous cooling, such as quenching and annealing.
- Predicting the final microstructure and properties of a material after a specific cooling cycle.
- Selecting appropriate cooling rates to achieve desired microstructures.
In essence, if the heat treatment involves holding at a constant temperature, the TTT diagram is the appropriate tool. If the heat treatment involves continuous cooling, the CCT diagram offers a more accurate representation.
Conversion Considerations
Converting between TTT and CCT diagrams is not a straightforward process. The relationship between the two is complex and depends on various factors, including the material's composition, austenitizing temperature, and cooling rate.
While empirical relationships and computational models exist to approximate the conversion, these methods are often limited in their accuracy. It is generally recommended to use the diagram that best represents the actual heat treatment conditions. Attempting to precisely translate a TTT diagram into a CCT diagram (or vice versa) can lead to inaccurate predictions.
It's important to recognize that CCT diagrams are experimentally determined for specific cooling rates. Therefore, they directly reflect the microstructural evolution under those conditions, making them a more reliable tool for predicting the outcomes of continuous cooling processes.
TTT diagrams are incredibly useful tools, but it's important to remember that they are representations of reality, not reality itself. Like any model, they operate under certain assumptions and simplifications that limit their applicability in certain situations. Recognizing these limitations is crucial for using TTT diagrams effectively and avoiding potential pitfalls in heat treatment design and materials selection.
Limitations of TTT Diagrams
While TTT diagrams provide valuable insights into phase transformations, it is crucial to understand their inherent limitations. They are based on idealized conditions and specific assumptions, and neglecting these can lead to inaccurate predictions and suboptimal heat treatment strategies.
Simplifications and Assumptions
TTT diagrams are constructed under very specific conditions, primarily isothermal transformations. This means the material is rapidly quenched to a constant temperature and held there until the transformation is complete. This is rarely the case in industrial heat treatment processes.
-
Isothermal Conditions: The biggest assumption is that the transformation occurs at a constant temperature. In reality, cooling rates vary throughout the material, leading to temperature gradients and non-isothermal conditions.
-
Homogeneous Austenite: TTT diagrams assume a homogeneous austenitic starting microstructure. However, variations in chemical composition or prior processing can lead to non-uniform austenite, affecting the transformation kinetics.
-
Neglect of Stress Effects: The diagrams typically ignore the influence of stress, which can significantly alter transformation behavior. Applied stress or residual stress can accelerate or retard phase transformations.
-
Ideal Cooling: TTT diagrams also disregard the effects of surface oxidation or decarburization, which can change the composition and properties of the material near the surface.
Not Applicable to All Materials
TTT diagrams are most commonly used for steels, but they are not universally applicable to all materials. Their suitability depends on the material's composition and transformation behavior.
-
Diffusion-Controlled Transformations: TTT diagrams are best suited for materials where phase transformations are primarily controlled by diffusion. For materials with diffusionless transformations, such as some martensitic transformations, TTT diagrams may not provide accurate predictions.
-
Limited Alloying Elements: The presence of certain alloying elements can significantly alter transformation kinetics, making existing TTT diagrams inaccurate. Custom TTT diagrams may need to be developed for specific alloy compositions.
-
Non-Ferrous Alloys: While TTT diagrams can be constructed for some non-ferrous alloys, they are not as widely used or readily available as they are for steels. The transformation behavior of many non-ferrous alloys is more complex and may not be accurately represented by a TTT diagram.
-
Materials with Complex Phase Diagrams: Materials with very complex phase diagrams or multiple competing transformations may not be easily represented by a single TTT diagram. In such cases, more advanced modeling techniques may be required.
Video: TTT Diagram Demystified: Master Time-Temperature-Transformation
TTT Diagrams Demystified: Your Questions Answered
Still have questions about Time-Temperature-Transformation (TTT) diagrams? Here are some of the most frequently asked questions to help you master understanding them.
What exactly does a TTT diagram show?
A TTT diagram visually represents the transformation of austenite (a high-temperature phase of steel) into various other microstructures like pearlite, bainite, and martensite, over time at different temperatures. It helps predict the final microstructure based on the cooling rate applied.
How do I read a TTT diagram?
The diagram plots temperature on the Y-axis and time (usually on a logarithmic scale) on the X-axis. Curves on the TTT diagram indicate the start and finish times for phase transformations at specific temperatures. Different cooling paths plotted on the diagram will intersect different transformation regions, resulting in different microstructures.
Why are TTT diagrams important in heat treatment?
TTT diagrams are crucial for designing effective heat treatment processes. By understanding how temperature and time affect phase transformations, engineers can use the ttt diagram to control the microstructure of steel, tailoring its mechanical properties (hardness, strength, ductility) to specific applications.
What happens if I cool steel too quickly according to a TTT diagram?
If steel is cooled too rapidly, bypassing the "nose" of the TTT diagram, it will transform into martensite. Martensite is very hard and brittle. While sometimes desirable, rapid cooling may require subsequent tempering to improve toughness by reducing internal stresses.