Graphing Piecewise Functions on Desmos: Guide
Graphing piecewise functions on Desmos, a powerful online graphing calculator developed by Desmos Studio, involves understanding how to define different function segments over specific intervals. Piecewise functions, characterized by multiple sub-functions each applying to a certain domain, can be visualized on a coordinate plane using Desmos's conditional function notation. The accurate representation of these functions benefits students and educators alike, particularly those engaged with curricula aligned with standards set forth by organizations such as the National Council of Teachers of Mathematics (NCTM). Mastery in graphing piecewise functions on Desmos is also useful in applied mathematics and engineering, helping professionals like electrical engineers model systems that change behavior based on input thresholds.
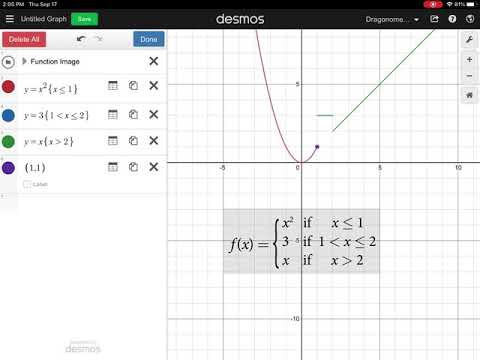
Image taken from the YouTube channel Dragonometry , from the video titled Graphing Piecewise Functions with Desmos .
Piecewise functions are mathematical constructs that describe relationships using different formulas across distinct intervals of their domain. Instead of a single, unbroken equation, piecewise functions are composed of multiple "pieces," each governing the function's behavior within a specific range of input values.
These functions are not merely abstract curiosities; they are powerful tools for modeling real-world phenomena that exhibit varying behaviors under different conditions. To fully understand and utilize these functions, effective visualization is key. This is where Desmos, the intuitive online graphing calculator, becomes invaluable.
Understanding Piecewise Functions
A piecewise function is, at its core, a collection of sub-functions. Each sub-function is defined over a particular interval or segment of the x-axis.
These intervals are typically defined using inequalities, specifying the conditions under which each sub-function applies. For instance, a function might be defined as f(x) = x^2 for x < 0 and f(x) = 2x + 1 for x >= 0. This means the function behaves like a parabola to the left of zero and like a straight line to the right.
The ability to express such varied behavior within a single function is what makes piecewise functions so versatile.
The Relevance of Piecewise Functions
Piecewise functions find application in diverse fields:
-
Economics: Modeling tax brackets where different income levels are taxed at different rates.
-
Engineering: Describing the behavior of a system that changes abruptly under certain conditions (e.g., a thermostat controlling temperature).
-
Computer Graphics: Creating complex shapes and curves by combining simpler geometric forms.
-
Physics: Modeling forces or motion that change discontinuously.
These examples highlight the practical importance of understanding piecewise functions and being able to manipulate them effectively.
Desmos: Your Visual Toolkit
Desmos is a free, online graphing calculator that makes visualizing mathematical functions remarkably easy. Its intuitive interface and real-time graphing capabilities provide immediate feedback.
-
With Desmos, students and professionals alike can quickly graph piecewise functions, explore their properties, and gain deeper insights into their behavior.
-
The ability to manipulate the function's parameters and observe the resulting changes in the graph fosters a dynamic, interactive learning experience.
-
Desmos empowers users to go beyond rote memorization and develop a genuine, intuitive understanding of piecewise functions.
In essence, Desmos serves as a powerful lens through which we can examine and demystify the world of piecewise functions. It transforms abstract equations into tangible, visual representations, making them accessible and engaging.
Foundational Concepts: A Mathematical Refresher
Piecewise functions are mathematical constructs that describe relationships using different formulas across distinct intervals of their domain. Instead of a single, unbroken equation, piecewise functions are composed of multiple "pieces," each governing the function's behavior within a specific range of input values. These functions are foundational in modeling real-world phenomena with varied behaviors depending on the input. Before diving into Desmos and graphing these functions, it’s crucial to solidify our understanding of the fundamental mathematical concepts that underpin them.
This section will serve as a refresher on essential mathematical ideas, including function notation, domain, range, interval notation, inequalities, and commonly used function types, all of which are indispensable for effectively working with piecewise functions.
Function Notation: The Language of Functions
Function notation is the shorthand we use to express the relationship between an input and an output. The standard notation, f(x), denotes a function named "f" that takes "x" as its input and produces a corresponding output value.
Understanding function notation is essential because it allows us to express piecewise functions concisely. Each "piece" of the function is typically defined using function notation, specifying the mathematical operation to be performed on the input x within a particular interval.
Domain and Range: Defining Boundaries
The domain of a function is the set of all possible input values (x-values) for which the function is defined.
The range, on the other hand, is the set of all possible output values (y-values) that the function can produce.
For piecewise functions, determining the domain and range requires careful consideration of the intervals over which each piece is defined. The domain is often expressed as a union of intervals, reflecting the combined domains of the individual pieces.
The range must be determined by analyzing the output of each piece over its corresponding interval.
Interval Notation: A Precise Way to Specify Intervals
Interval notation is a standardized way to represent intervals of real numbers. It uses brackets and parentheses to indicate whether the endpoints of the interval are included or excluded.
-
A square bracket "[" or "]" indicates that the endpoint is included in the interval. For example,
[a, b]represents all real numbers between a and b, including a and b. -
A parenthesis "(" or ")" indicates that the endpoint is not included in the interval. For example,
(a, b)represents all real numbers between a and b, excluding a and b.
Interval notation is crucial for defining the intervals over which each piece of a piecewise function is valid. For example, if a piece is defined for all x greater than or equal to 0 but less than 5, we would express the interval as [0, 5).
Inequalities: Defining the Pieces
Inequalities are mathematical expressions that compare two values using symbols such as < (less than), > (greater than), ≤ (less than or equal to), and ≥ (greater than or equal to).
In the context of piecewise functions, inequalities are used to define the conditions under which each piece of the function applies. For example, a piecewise function might be defined as f(x) = x² for x < 0 and f(x) = 2x + 1 for x ≥ 0. Here, the inequalities x < 0 and x ≥ 0 define the intervals over which each piece is valid.
Common Function Types in Piecewise Functions
Piecewise functions often combine different types of functions, each contributing to the overall behavior. Let's examine some common building blocks:
Linear Functions: Straight Lines
Linear functions are of the form y = mx + b, where m is the slope and b is the y-intercept. Their graphs are straight lines. In piecewise functions, linear segments can create sharp changes in direction.
Quadratic Functions: Parabolas
Quadratic functions are of the form y = ax² + bx + c, where a, b, and c are constants. Their graphs are parabolas. These can add curvature and complexity to piecewise functions.
Absolute Value Functions: The "V" Shape
The absolute value function, y = |x|, returns the magnitude of x, regardless of its sign. It can be expressed as a piecewise function:
|x| = {x, x>=0; -x, x<0}
Its graph is a "V" shape, with a sharp corner at the origin.
Continuity and Discontinuity: Joining the Pieces
A function is continuous if its graph can be drawn without lifting your pen from the paper. In other words, there are no breaks or jumps in the graph.
A function is discontinuous at a point if there is a break, jump, or hole in the graph at that point.
Piecewise functions can exhibit discontinuities at the boundaries between intervals if the pieces do not "meet" smoothly. Understanding continuity and discontinuity is critical for analyzing the behavior of piecewise functions and their real-world implications. Recognizing these aspects is vital for accurate interpretation and application.
Getting Started with Desmos: A Step-by-Step Guide
Building on the foundational mathematical concepts, we now transition to the practical application of graphing piecewise functions using Desmos. Desmos offers an intuitive and powerful platform to visualize and analyze these functions, bridging the gap between theory and practical understanding.
This section will guide you through the essential steps, from accessing Desmos to exploring the intricacies of piecewise function behavior.
Desmos is a free, online graphing calculator renowned for its user-friendly interface and robust capabilities. It allows users to effortlessly plot various types of functions, including piecewise functions, explore their properties, and gain a deeper understanding of mathematical concepts.
Desmos goes beyond simple plotting, offering interactive features that enhance the learning experience.
Accessing Desmos
You can access Desmos through its website (www.desmos.com) using any modern web browser.
Alternatively, Desmos also offers a mobile app available for both iOS and Android devices.
While creating an account is optional, it allows you to save your graphs and access them from any device.
Inputting Piecewise Functions in Desmos
The core of graphing piecewise functions in Desmos lies in understanding its specific syntax.
Desmos uses curly braces {} to define the different pieces of the function and conditional statements to specify the domain for each piece.
Syntax Essentials
The general structure for a piecewise function in Desmos is as follows:
f(x) = {condition1: expression1, condition2: expression2, condition3: expression3, ...}
Each condition is a Boolean expression that defines the interval for the corresponding expression.
For example, x < 0 restricts the domain to all values of x less than zero.
The colon : separates the condition from the expression that applies within that interval.
Examples with Interval Restrictions
Let's illustrate this with a few practical examples:
-
Example 1: A simple piecewise function
f(x) = {x < 0: x^2, x >= 0: 2x + 1}This function defines
f(x)asx²whenxis less than 0, and as2x + 1whenxis greater than or equal to 0. -
Example 2: A piecewise function with three parts
g(x) = {x < -1: -x, -1 <= x <= 1: x^2, x > 1: x}Here,
g(x)is defined differently across three intervals:x < -1,-1 <= x <= 1, andx > 1. -
Example 3: Incorporating absolute value (explained as piecewise)
h(x) = {x < 0: -x, x >= 0: x}This is the piecewise representation of the absolute value function,
|x|.
Defining as Multiple Functions
Another approach is to define each piece of the function as a separate function, then combine them using the same curly brace syntax:
f1(x) = x^2
f2(x) = 2x + 1
f(x) = {x < 0: f1(x), x >= 0: f2(x)}
This method can enhance readability, especially for complex piecewise functions.
Restricting Domain
Restricting the domain is crucial for accurately representing piecewise functions. Desmos achieves this seamlessly through the use of inequalities within the curly braces. The inequalities act as "switches," activating the corresponding function piece only when the condition is met.
- Use
<(less than),>(greater than),<=(less than or equal to), and>=(greater than or equal to) to define the intervals. - Combine inequalities to define bounded intervals, such as
-2 <= x <= 2.
Exploring Function Behavior
Desmos provides interactive features that allow you to delve deeper into the behavior of piecewise functions.
Visualizing Sub-functions
- Zooming: Use the zoom in/out controls or your mouse wheel to examine the function's behavior at different scales.
- Tracing: Hover your cursor over the graph to trace the function's path and see the corresponding x and y values.
Identifying Discontinuities
Pay close attention to the points where the pieces of the function meet. These points may reveal discontinuities, where the function "jumps" or has a "hole."
Discontinuities are significant because they indicate points where the function is not continuous, impacting its differentiability and other properties.
Analyzing Overall Shape and Characteristics
Consider the following aspects when analyzing a piecewise function:
- Continuity: Is the function continuous at the boundaries between intervals?
- Differentiability: Is the function differentiable at all points, or are there sharp corners or vertical tangents?
- Asymptotic Behavior: Does the function approach any horizontal or vertical asymptotes as x approaches positive or negative infinity?
Desmos Geometry Tool
The Desmos Geometry Tool provides another avenue for constructing functions. Complex figures can be created and then referenced with functions on the Desmos Graphing Calculator.
This tool allows for creative flexibility for developing piecewise functions for unique use cases.
Advanced Techniques and Applications
Building on the foundational mathematical concepts, we now transition to the practical application of graphing piecewise functions using Desmos.
Desmos offers an intuitive and powerful platform to visualize and analyze these functions, bridging the gap between theory and practical understanding.
This section explores advanced techniques for creating complex piecewise functions, discusses relevant real-world applications, and addresses common troubleshooting issues.
Creating Complex Piecewise Functions
Piecewise functions become significantly more powerful when we start combining various function types within a single definition.
Desmos allows you to seamlessly integrate linear, quadratic, exponential, trigonometric, and other function types into a single piecewise expression.
To do this, you nest each function within its defined interval using the curly brace notation { condition: function }.
For instance, consider a function that behaves linearly for negative values, quadratically between 0 and 5, and exponentially beyond 5:
f(x) = { x < 0: x + 2, 0 <= x <= 5: x^2 - 3x, x > 5: 2^x }
This syntax tells Desmos to use x + 2 when x is less than 0, x^2 - 3x when x is between 0 and 5 (inclusive), and 2^x when x is greater than 5.
Pro Tip: Pay close attention to interval endpoints and ensure there are no overlapping or undefined regions.
Defining functions with multiple pieces and intervals is a straightforward extension of the basic syntax.
You simply add more { condition: function } pairs within the outermost curly braces, separated by commas.
A function can have as many pieces as needed, each with its own unique domain restriction.
For example, a piecewise function defined over four different intervals might look like this:
f(x) = { x < -2: -x, -2 <= x < 0: x^2, 0 <= x < 2: 2x, x >= 2: 4 }
This function uses different definitions for x values less than -2, between -2 and 0, between 0 and 2, and greater than or equal to 2, respectively.
The key is to ensure each interval is clearly defined and doesn't overlap with others.
Applications of Piecewise Functions
Piecewise functions are invaluable for modeling real-world scenarios that exhibit different behaviors under varying conditions.
Their versatility makes them suitable for describing diverse phenomena in economics, physics, and computer science.
Tax Brackets
Tax brackets are a classic example of piecewise functions in action.
The tax rate applied to an individual's income changes depending on which income bracket they fall into.
Each bracket represents a different "piece" of the function, with a specific tax rate assigned to it.
Step Functions
Step functions, also known as staircase functions, are piecewise functions where the output remains constant over specific intervals before abruptly changing to a new value.
These functions are often used to model scenarios like postage rates, where the price increases in discrete steps based on weight.
Modeling with Desmos
Desmos makes it incredibly easy to model such scenarios graphically.
Let's consider a simplified tax bracket system:
- 10% for income up to \$10,000
- 20% for income between \$10,000 and \$50,000
- 30% for income above \$50,000
We can define this in Desmos as:
tax(income) = { income <= 10000: 0.1 income, 10000 < income <= 50000: 0.2 income, income > 50000: 0.3 * income }
Plotting this function immediately visualizes how the tax liability changes with income.
By adjusting the parameters (tax rates and bracket thresholds), you can easily explore the effects of different tax policies.
Desmos allows interactive exploration of real-world parameters.
Troubleshooting Common Issues
Even with Desmos's intuitive interface, encountering syntax errors when defining piecewise functions is common.
One frequent mistake is incorrect use of curly braces or missing colons.
Ensure that each condition: function pair is properly formatted.
Another common issue is overlapping or undefined intervals.
Desmos will typically graph the function based on the order of definition.
However, this might not always be the intended behavior.
Double-check your inequalities to ensure that each value of x falls into exactly one interval.
Use Desmos's visual feedback to diagnose interval issues.
For instance, a function like f(x) = { x < 5: x^2, x > 3: 2x } will graph x^2 for x < 5 and 2x for x > 3.
But, there's an overlap between x = 3 and x = 5.
Desmos will use the first defined function in this interval.
However, this might not be what is intended, so explicit interval definitions are necessary to avoid ambiguity.
Always verify that your interval definitions are clear and non-overlapping to achieve the desired graph.
Video: Graphing Piecewise Functions on Desmos: Guide

FAQ: Graphing Piecewise Functions on Desmos: Guide
How do I create a piecewise function on Desmos?
You use curly braces {} to define the domain restrictions for each piece. For example, y = x{x<0}, x^2{x>=0} creates a piecewise function: x when x is less than 0, and x^2 when x is greater than or equal to 0. That's the key to graphing piecewise functions on Desmos.
What does the {} symbol do in Desmos when graphing piecewise functions?
The curly braces {} in Desmos are used to specify the domain over which a particular part of the function is defined. They essentially act as a conditional statement, limiting the part of the function to only the specified interval. This is essential for correctly graphing piecewise functions on Desmos.
How do I graph a piecewise function with more than two pieces on Desmos?
Simply add more parts within the equation, separated by commas. Each part should include the function and its domain restriction within curly braces. For instance, f(x)=x{x<0}, x^2{0<=x<2}, 4{x>=2} is a piecewise function with three pieces. Desmos handles graphing piecewise functions of any number of parts smoothly.
What if I want an open circle (non-inclusive) endpoint on my piecewise function graph?
Use < or > in your domain restrictions. If you want to include the endpoint (closed circle), use <= or >=. By using these inequalities when graphing piecewise functions on Desmos, you define the range of each function segment.
So, that's pretty much it! Hopefully, you're now feeling confident and ready to tackle graphing piecewise functions on Desmos. Get in there, experiment, and don't be afraid to make mistakes – that's how you learn! Happy graphing!