Contour Map Secrets: Decode Landscapes Like a Pro!
A contour map, a fundamental tool in geography, provides a visual representation of elevation and terrain. Land surveyors often utilize these maps to accurately depict the three-dimensional landscape on a two-dimensional surface. The principles of topographic mapping are crucial for understanding the spatial relationships presented within a contour map. Furthermore, geographic information systems (GIS) software enables professionals to analyze and manipulate contour data for various applications, including land management and environmental planning. Grasping these Contour Map Secrets will definitely set you apart in your knowledge.
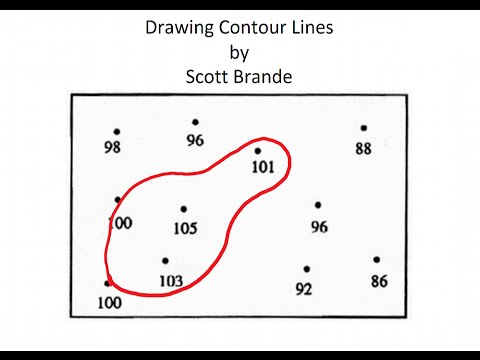
Image taken from the YouTube channel Scott Brande , from the video titled How to Draw Contour Lines on a Map .
Imagine holding a magic key – a key that unlocks the secrets of the land, revealing its hidden valleys, towering peaks, and subtle undulations. This key exists, not in the realm of fantasy, but in the form of contour maps.
These seemingly complex diagrams are, in essence, powerful tools for understanding and navigating our three-dimensional world, compressed onto a two-dimensional surface. They offer a unique perspective, allowing us to "read" the landscape as if we were soaring above it, observing its every curve and contour.
What Exactly is a Contour Map?
At its core, a contour map is a graphical representation of terrain elevation. It employs contour lines – lines that connect points of equal elevation.
Think of it like slicing through a mountain at regular intervals and then tracing the outline of each slice onto a flat piece of paper. The resulting pattern of lines reveals the shape of the land.
The closer the lines are together, the steeper the slope; the farther apart, the gentler the terrain.
A Versatile Tool for Diverse Applications
The beauty of contour maps lies in their versatility. They are indispensable in a wide array of fields and activities, extending far beyond recreational pursuits.
For the avid hiker, a contour map is an essential companion, aiding in route planning, identifying potential hazards, and understanding the challenges ahead.
Urban planners rely on contour maps to assess the suitability of land for development, considering factors such as slope stability and drainage patterns.
Environmental scientists use them to study erosion, monitor changes in land elevation, and assess the impact of human activities on the landscape.
Civil engineers employ contour data for designing roads, bridges, and other infrastructure projects, ensuring that they are appropriately aligned with the natural terrain.
Even in unexpected fields like precision agriculture, contour maps help optimize irrigation and manage soil erosion.
Decoding the Landscape: A Promise of Understanding
This article serves as your guide to decoding the language of contour maps. We will demystify the seemingly complex symbols and patterns, empowering you to interpret the information they convey.
By understanding the principles behind contour lines, you can learn to visualize the landscape in three dimensions, anticipate changes in elevation, and make informed decisions about your route, your project, or your study.
Whether you are planning a backpacking trip, researching a construction site, or simply curious about the world around you, the ability to read a contour map is a valuable skill that will enrich your understanding of the land.
Join us as we embark on a journey to unlock the secrets hidden within these fascinating and informative maps.
Imagine holding a magic key – a key that unlocks the secrets of the land, revealing its hidden valleys, towering peaks, and subtle undulations. This key exists, not in the realm of fantasy, but in the form of contour maps.
These seemingly complex diagrams are, in essence, powerful tools for understanding and navigating our three-dimensional world, compressed onto a two-dimensional surface. They offer a unique perspective, allowing us to "read" the landscape as if we were soaring above it, observing its every curve and contour.
Environmental scientists use them to study changes in terrain over time, assess the impact of erosion, and model the flow of water across the landscape. To truly unlock the potential of these maps, we must first understand the fundamental element upon which they are built: the contour line.
Decoding Contour Lines: The Language of the Land
Contour lines are the very essence of a contour map, the visual vocabulary that translates the shape of the land into a format we can understand.
They are not arbitrary markings but rather meticulously drawn lines that connect points of equal elevation.
Imagine walking along a perfectly level path around a hill; the path you trace would represent a contour line.
What is a Contour Line?
At its most basic, a contour line represents a specific elevation above a reference point, usually mean sea level.
Every point along that line shares the same altitude.
Think of it as a horizontal slice through the terrain, and the contour line marks where that slice intersects with the ground.
By showing the outlines of different elevation bands, contour lines reveal the hills, valleys, and flat stretches that define the landscape.
The Relationship Between Line Spacing and Slope
The spacing between contour lines is perhaps the most crucial piece of information they convey.
It directly correlates to the steepness of the slope.
Closely spaced lines indicate a steep slope, meaning the elevation changes rapidly over a short horizontal distance.
Imagine climbing a mountain where the contour lines are packed tightly together; you would be ascending (or descending) quickly.
Conversely, widely spaced lines indicate a gentle slope, where the elevation changes gradually.
A leisurely stroll across a meadow would be represented by contour lines that are far apart.
Visualizing Slope: Examples
To truly grasp this concept, consider a few visual examples:
-
Steep Cliff: Imagine a cliff face. On a contour map, this would be represented by contour lines that are extremely close together, almost merging into a single line. This signifies a rapid change in elevation over a very short distance.
-
Gentle Hillside: A gentle hillside, on the other hand, would be depicted by contour lines that are spaced relatively far apart. The wider the spacing, the more gradual the slope.
-
Flat Area: A completely flat area, such as a plain or a plateau, would be represented by either a complete absence of contour lines or by contour lines that are very far apart and nearly parallel. This indicates little to no change in elevation.
-
Valley: A valley would be represented by contour lines forming V-shapes, pointing uphill.
By recognizing these patterns, you can begin to "see" the three-dimensional shape of the land, even when looking at a flat map.
Imagine walking along a perfectly level path around a hill; the path you trace would represent a contour line. What is a Contour Line? At its most basic, a contour line represents a specific elevation above a reference point, usually mean sea level. Every point along that line shares the same altitude. Think of it as a horizontal slice through the terrain, and the contour line marks the edge of that slice. But how do we translate these lines into actual heights and understand the magnitude of elevation changes?
Elevation Essentials: Understanding Height and Change
Deciphering elevation from contour maps is fundamental to understanding the terrain they depict. You will need to grasp how to determine the elevation of points directly on a contour line, what a contour interval signifies, and how to estimate elevation between lines.
Finding Elevation on a Contour Line
The most straightforward way to determine elevation is to locate a point directly on a contour line. Each contour line represents a specific elevation, usually marked at intervals along the line.
If a point sits precisely on a contour line labeled "500 feet," then that point's elevation is, without a doubt, 500 feet above the reference datum (typically mean sea level).
These labeled lines are your direct links to understanding the height of the land at that specific location.
The Contour Interval: Measuring Vertical Distance
While contour lines indicate specific elevations, the contour interval reveals the difference in elevation between adjacent contour lines. It's the constant vertical distance separating each line on the map.
The contour interval is usually stated in the map's legend (e.g., "Contour Interval = 20 feet"). This interval is critical for understanding the scale of elevation changes depicted on the map.
Understanding the Significance
A smaller contour interval (e.g., 10 feet) indicates more subtle changes in elevation and a more detailed representation of the terrain.
A larger contour interval (e.g., 100 feet) suggests more significant elevation changes and a less detailed representation.
Locating the Contour Interval on a Map
The contour interval is typically found in the map's legend or margin, often near the scale bar and other map information. Always check the contour interval before interpreting elevation changes on a map to ensure accurate understanding.
Estimating Elevation Between Contour Lines
What happens when the point of interest lies between two contour lines? In these instances, we need to estimate the elevation.
This is where interpolation comes in.
The Process of Interpolation
Assume a point lies halfway between the 600-foot and 700-foot contour lines, with a contour interval of 100 feet. A reasonable estimate for the point's elevation would be 650 feet.
The accuracy of this estimation depends on the assumption of a constant slope between the contour lines.
In reality, the slope might vary, leading to slight discrepancies in the estimated elevation.
Best Practices for Estimation
-
Examine the spacing: If the point is closer to one contour line than the other, adjust your estimate accordingly. For instance, if the point is closer to the 600-foot line, estimate slightly below 650 feet.
-
Consider terrain: Use your understanding of landforms. Is the area known for uniform slopes, or does it feature variable terrain? Adjust estimations based on this knowledge.
-
Use caution: Remember that estimation provides an approximation, not an exact measurement. For precise elevation data, consult specialized surveying tools or digital elevation models.
Elevation is just one piece of the puzzle; understanding how these elevations come together to form the landscape is where contour maps truly shine. By examining the patterns created by contour lines, we can begin to visualize the three-dimensional world on a two-dimensional surface, unlocking a deeper understanding of the terrain.
Topography and Relief: Visualizing the Three-Dimensional World
Contour lines are more than just indicators of elevation; they are the brushstrokes that paint a picture of the land's overall shape and form. Understanding how these lines come together allows us to interpret the topography, the arrangement of natural and artificial physical features of an area, and relief, the variations in elevation within that area. This understanding is essential for informed decision-making in various fields, from urban planning to environmental conservation.
Understanding Topography Through Contour Lines
Topography describes the lay of the land, encompassing all its natural and artificial features. Contour lines visually represent this, offering clues about the terrain's character. Closely spaced contour lines signify steep terrain, while widely spaced lines indicate gentler slopes. The direction and curvature of the lines reveal the presence of various landforms. By carefully observing these patterns, we can discern the landscape's overall form, creating a mental model of the terrain's three-dimensional structure.
Recognizing Landforms Through Contour Patterns
Specific landforms are often characterized by distinct contour line patterns:
-
Hills and Mountains: These are typically represented by concentric, roughly circular contour lines. The innermost circle represents the summit, with elevation increasing towards the center.
-
Valleys: Valleys often exhibit V-shaped or U-shaped contour patterns. The "V" points upstream, indicating the direction of water flow. The contour lines are more widely spaced, and the slope angles are less pronounced as we reach the valley floor.
-
Ridges: Ridges are elongated high-elevation areas, often depicted by elongated, parallel contour lines that run along the length of the ridge. The contour lines on either side of the ridge typically slope downwards, indicating the descending terrain.
-
Depressions: Depressions, such as sinkholes or craters, are represented by closed contour lines with hachure marks (short, perpendicular lines) pointing inwards. These hachure marks indicate that the elevation is decreasing towards the center of the closed contour.
Relief vs. Topography: Distinguishing Key Concepts
While often used interchangeably, relief and topography represent distinct aspects of the landscape. Relief refers specifically to the difference in elevation between the highest and lowest points in a given area. It's a quantitative measure of vertical variation. Topography, on the other hand, encompasses the overall shape and arrangement of landforms, including their relative positions and characteristics. It's a more qualitative description of the landscape's structure. In essence, relief contributes to the broader understanding of topography. A high relief area implies significant elevation changes, contributing to a more dramatic and varied topography.
Elevation is just one piece of the puzzle; understanding how these elevations come together to form the landscape is where contour maps truly shine. By examining the patterns created by contour lines, we can begin to visualize the three-dimensional world on a two-dimensional surface, unlocking a deeper understanding of the terrain.
Topography and Relief: Visualizing the Three-Dimensional World
Contour lines are more than just indicators of elevation; they are the brushstrokes that paint a picture of the land's overall shape and form. Understanding how these lines come together allows us to interpret the topography, the arrangement of natural and artificial physical features of an area, and relief, the variations in elevation within that area. This understanding is essential for informed decision-making in various fields, from urban planning to environmental conservation.
Slope and Gradient: Measuring Steepness
While understanding landforms gives a qualitative sense of the terrain, slope and gradient offer a way to quantify the steepness of the land. This provides crucial information for a variety of activities, from assessing the difficulty of a hiking trail to predicting potential landslide hazards. Being able to derive these values from a contour map empowers you to make informed decisions about navigating and interacting with the landscape.
Defining Slope and Gradient
Slope and gradient are both measures of steepness, essentially describing how much the elevation changes over a given horizontal distance.
While often used interchangeably, there's a subtle distinction: slope is generally expressed as an angle (in degrees), while gradient is often expressed as a ratio or percentage.
For example, a 45-degree slope would have a 100% gradient (a rise of 1 unit for every 1 unit of horizontal distance).
Understanding both concepts is helpful, as different fields and maps may use one or the other.
Estimating Slope from Contour Line Spacing
Contour maps provide a visual way to estimate slope without complex calculations. The key lies in observing the spacing between contour lines.
Remember the principle: closely spaced lines indicate steep slopes, and widely spaced lines indicate gentle slopes.
To estimate the slope, consider these factors:
- Horizontal Distance: Estimate (using the map scale) the horizontal distance between two adjacent contour lines.
- Contour Interval: Note the vertical distance (elevation change) between those same two lines (this is the contour interval).
- Relative Comparison: Mentally compare the horizontal distance and the contour interval. A small horizontal distance with a significant contour interval indicates a steep slope. A large horizontal distance with the same contour interval indicates a gentle slope.
While this method provides an estimation, it's a surprisingly effective way to quickly assess the relative steepness of different areas on a map. For more precise calculations, the following formula can be used with real-world measurements: Slope = (Rise / Run) * 100, expressed as a percentage.
Implications of Steep Slopes
Steep slopes have significant implications for anyone interacting with the landscape.
For hikers, steep slopes translate directly to increased exertion and slower progress. They may require specialized techniques, such as switchbacks, to ascend or descend safely.
Steep slopes can also pose hazards, including:
- Increased risk of falls: Losing your footing on a steep slope can have serious consequences.
- Potential for landslides and rockfalls: Unstable slopes are more prone to these events, especially during or after heavy rain.
- Increased avalanche danger: In mountainous areas with snow, steep slopes are prime avalanche terrain.
By recognizing areas of steep slope on a contour map, hikers and other outdoor enthusiasts can plan their routes accordingly, choosing safer alternatives or preparing for the challenges ahead. It's an essential element of responsible and safe navigation in any terrain.
Elevation is just one piece of the puzzle; understanding how these elevations come together to form the landscape is where contour maps truly shine. By examining the patterns created by contour lines, we can begin to visualize the three-dimensional world on a two-dimensional surface, unlocking a deeper understanding of the terrain.
Index Contours and Spot Heights: Key Reference Points
Navigating the intricate web of contour lines can initially feel overwhelming. Thankfully, cartographers provide helpful shortcuts: index contours and spot heights. These serve as key reference points, allowing you to quickly grasp the elevation context of a map and orient yourself with greater ease. They're like the street signs of the topographic world.
Understanding Index Contours
Imagine trying to find a specific street address without street signs. That's what navigating a contour map without index contours would be like.
Index contours are thicker, darker contour lines that are clearly labeled with their elevation. They appear at regular intervals, such as every fifth contour line.
Their primary purpose is to provide a quick and easy way to determine the elevation of a particular area on the map. Without them, you would have to count up or down from a known elevation. This can be tedious and prone to error.
For example, if the contour interval is 20 feet, the index contours might be at 100-foot intervals (100, 200, 300 feet, and so on).
The boldness and labeling of index contours make them immediately recognizable. This makes it much easier to determine your approximate elevation, which is especially helpful in areas with complex terrain.
The Role of Spot Heights
While index contours provide elevation references across broad areas, spot heights offer precise elevation data for specific points.
A spot height is a point on a map with its elevation clearly marked, usually with a small 'x' or a dot followed by the elevation value.
Spot heights are often used to indicate the elevation of significant features such as:
- Summits of hills or mountains
- Road intersections
- Benchmarks
- Other key locations
They provide accurate elevation data for these specific locations. This accuracy is especially useful when you need precise elevation information for planning purposes or verifying your location.
Combining Index Contours and Spot Heights for Orientation
Index contours and spot heights work together to create a robust system for understanding elevation.
Use index contours to get a general sense of the terrain's elevation profile. Then use spot heights to pinpoint the exact elevation of particular features.
Here's how to use them together for orientation:
- Locate Nearby Index Contours: Identify the index contours closest to your location. This gives you a range of possible elevations.
- Find Spot Heights on Prominent Features: Look for spot heights on nearby hilltops, road junctions, or other easily identifiable features.
- Correlate with the Landscape: Compare the map information (index contours and spot heights) with what you see in the real world. This comparison allows you to pinpoint your location with greater accuracy.
By mastering the use of index contours and spot heights, you can significantly improve your ability to read and interpret contour maps. These are essential tools for efficient and accurate navigation. They also provide a deeper understanding of the landscape around you.
Elevation is just one piece of the puzzle; understanding how these elevations come together to form the landscape is where contour maps truly shine. By examining the patterns created by contour lines, we can begin to visualize the three-dimensional world on a two-dimensional surface, unlocking a deeper understanding of the terrain.
Map Scale Matters: Bridging the Gap Between Map and Reality
Contour maps are powerful tools, but their effectiveness hinges on understanding a critical concept: map scale. Map scale is the ratio that defines the relationship between a distance on the map and the corresponding distance on the ground. Ignoring this ratio is like trying to assemble a puzzle without knowing the size of the pieces; you might get a general idea, but the details will be distorted and unreliable.
Essentially, map scale dictates how much the real world has been shrunk down to fit onto the map. It governs the level of detail you can expect to see and influences the accuracy of your measurements.
Understanding Map Scale as a Ratio
Map scale is typically expressed as a ratio, such as 1:24,000. This means that one unit of measurement on the map (e.g., one inch) represents 24,000 of the same units on the ground (24,000 inches, which is equivalent to 2,000 feet).
Another common representation is a fractional scale, like 1/24,000, which conveys the same information.
Finally, a graphic scale, or bar scale, is a visual representation of the scale, usually printed on the map itself. This allows you to quickly measure distances using a ruler or other straightedge.
Measuring Distances Accurately
Once you know the map scale, you can accurately measure distances.
For instance, if you measure a distance of 2 inches between two points on a 1:24,000 scale map, the actual distance on the ground would be 2 inches x 24,000 = 48,000 inches, or 4,000 feet.
Use a ruler to measure the distance on the map. Then, multiply that measurement by the scale factor.
If you are using a graphic scale, you can directly compare the distance on the map to the bar on the graphic scale to determine the corresponding ground distance.
The Impact of Scale on Detail
The map scale significantly affects the level of detail depicted.
Large-Scale Maps
Large-scale maps, such as 1:24,000 or 1:12,000, show a smaller area with greater detail. They are ideal for activities like hiking, detailed site planning, and local navigation.
Individual buildings, small streams, and even prominent trees might be visible on a large-scale map.
Small-Scale Maps
Small-scale maps, such as 1:100,000 or 1:250,000, cover a larger area but with less detail. These maps are better suited for regional planning, long-distance travel, and getting a broad overview of a geographic area.
On a small-scale map, only major roads, rivers, and significant landmarks will typically be shown. Smaller features are generalized or omitted entirely.
Elevation is just one piece of the puzzle; understanding how these elevations come together to form the landscape is where contour maps truly shine. By examining the patterns created by contour lines, we can begin to visualize the three-dimensional world on a two-dimensional surface, unlocking a deeper understanding of the terrain.
Land Navigation and Hiking: Putting Your Skills to the Test
Contour maps transform from abstract diagrams into indispensable tools when you venture into the great outdoors. They are no longer just lines on paper; they are the key to understanding the landscape under your feet and making informed decisions for a safe and fulfilling hiking experience.
Mastering the art of using contour maps for land navigation and hiking empowers you to plan routes efficiently, anticipate potential hazards, and navigate confidently through diverse terrain. Whether you're a seasoned mountaineer or a weekend hiker, the skills you gain from interpreting these maps can significantly enhance your safety and enjoyment of the natural world.
Route Planning with Contour Maps: A Strategic Approach
Planning a hike using a contour map involves more than just tracing a line from point A to point B. It requires a careful analysis of the terrain to optimize your route for both efficiency and safety.
Slope awareness is paramount. Closely spaced contour lines indicate steep slopes, which can be physically demanding and potentially hazardous, especially in wet or icy conditions. Conversely, widely spaced lines suggest gentler slopes, making for easier hiking.
Elevation gain is another crucial factor to consider. A route with a significant elevation gain will require more effort and may be unsuitable for beginners or those with physical limitations. By studying the contour lines, you can estimate the total elevation gain for your hike and assess its feasibility.
By strategically choosing routes that minimize steep slopes and manageable elevation gains, you can conserve energy, reduce the risk of injury, and ultimately enjoy a more pleasant hiking experience.
Identifying Potential Hazards: Reading the Landscape for Safety
Contour maps are invaluable for identifying potential hazards that may not be immediately apparent on the ground.
Steep slopes, as indicated by closely spaced contour lines, pose a risk of slips and falls, especially on loose or unstable terrain. Cliffs and bluffs are often depicted by contour lines that converge or even merge, signaling a sudden and significant drop in elevation.
Areas with dense vegetation may be difficult to navigate, even with a map and compass. Contour lines can sometimes suggest areas of dense forest or thick undergrowth, allowing you to plan alternative routes or prepare accordingly.
Water crossings can also present hazards, especially during periods of heavy rain or snowmelt. Contour lines can help you identify potential stream or river crossings and assess their feasibility based on the surrounding terrain.
Mastering Navigation: Combining Map, Compass, and Observation
While contour maps provide a wealth of information about the terrain, they are most effective when used in conjunction with a compass and careful observation of your surroundings.
Orienting your map correctly is the first step in effective navigation. This involves aligning the map with the terrain using a compass, ensuring that the north arrow on the map points in the same direction as magnetic north.
Using a compass to take bearings allows you to determine the direction of travel to a specific point on the map. By following a compass bearing, you can maintain a consistent course, even in challenging terrain or poor visibility.
Regularly comparing the features on the map with what you see on the ground is essential for staying on course. Look for distinctive landmarks, such as peaks, valleys, and water bodies, and use them to confirm your location and direction of travel.
By mastering the art of map and compass navigation, you can confidently explore the backcountry, knowing that you have the skills and knowledge to find your way safely and efficiently.
Video: Contour Map Secrets: Decode Landscapes Like a Pro!

Contour Map Secrets: Frequently Asked Questions
Here are some frequently asked questions to help you better understand and utilize contour maps for landscape interpretation.
What exactly is a contour line on a map?
A contour line represents an imaginary line on the ground that connects points of equal elevation. Imagine slicing through a hill horizontally; each line on the contour map is where that slice intersects the land. These lines help us visualize the terrain's shape.
How do I determine the steepness of a slope using a contour map?
The closer the contour lines are together, the steeper the slope. Conversely, widely spaced contour lines indicate a gentle slope. Extremely close lines may even represent a cliff or very steep drop-off, making contour map reading essential for navigation.
What does a closed loop contour line usually indicate?
A closed loop contour line usually represents a hilltop or a depression. If the elevation values increase towards the center of the loop, it's a hilltop. If the elevation values decrease towards the center, it’s a depression, like a sinkhole.
Can contour maps be used for purposes other than hiking and navigation?
Yes, absolutely! Contour maps are valuable tools for various applications, including urban planning, construction, agriculture, and environmental studies. They help assess land suitability, plan infrastructure, and understand water flow patterns, highlighting the versatility of understanding a contour map.