Age Structure Diagram: US Population Guide
An age structure diagram represents a crucial tool for demographic analysis, revealing the distribution of a population across different age groups and sexes. The United States Census Bureau, a primary source of demographic data, compiles statistics essential for constructing these diagrams. Population pyramids, a common visual representation of age structure, provide insights into the potential for future population growth or decline, as highlighted in analyses conducted by organizations such as the Population Reference Bureau. Sociologist Dudley Kirk's work has significantly contributed to understanding the implications of age structure on social and economic dynamics, demonstrating how this data informs policies and resource allocation.
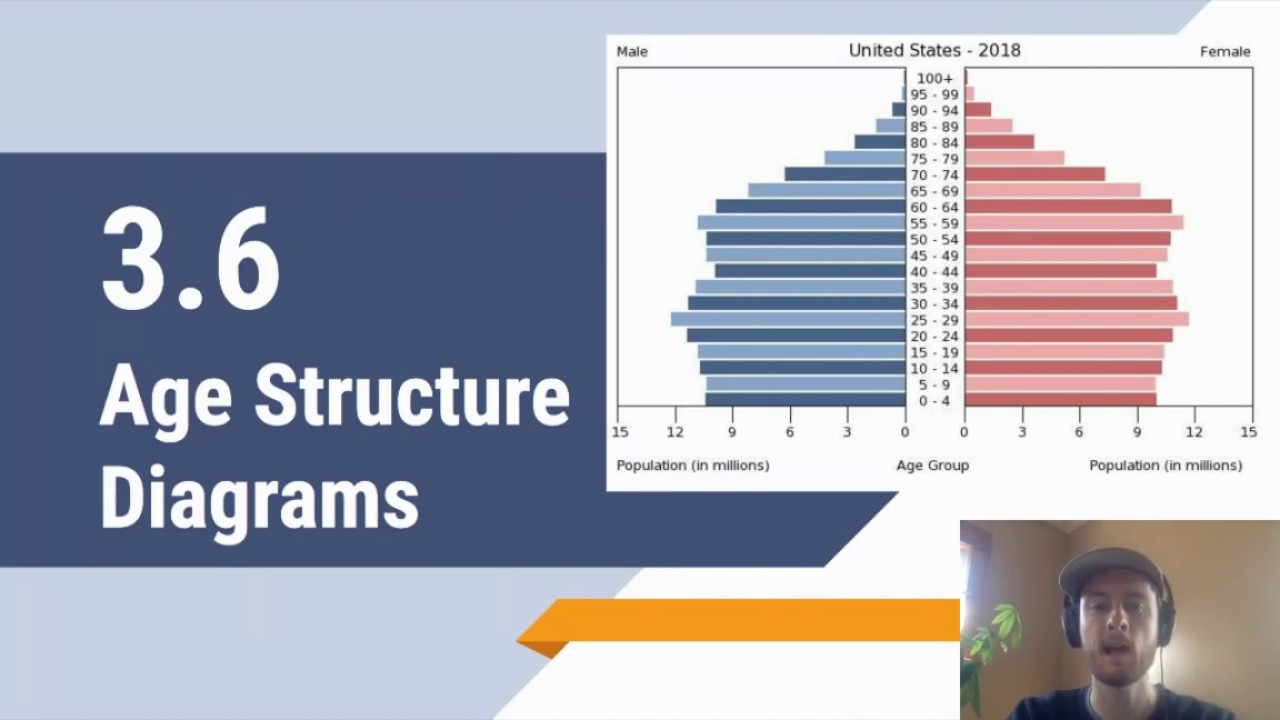
Image taken from the YouTube channel Jordan Dischinger-Smedes , from the video titled APES Video Notes 3.6 - Age Structure Diagrams .
Understanding Age Structure: A Foundation of Demographic Analysis
Age structure, at its core, describes the distribution of a population across various age cohorts. It's a fundamental demographic concept, providing a snapshot of a population's composition at a specific point in time. This distribution is not random; it reflects the cumulative effects of fertility, mortality, and migration patterns over decades.
Age Structure: Beyond Simple Demographics
Understanding age structure transcends simple counting. It unveils crucial insights into a society's past, present, and potential future. By examining the proportions of young, working-age, and elderly individuals, we gain invaluable perspectives.
These perspectives are essential for informed decision-making across various sectors.
Social, Economic, and Political Relevance
The relevance of age structure extends far beyond academic interest. It directly impacts social, economic, and political systems. An aging population, for example, places strain on pension systems and healthcare infrastructure, demanding policy adjustments.
A large youth bulge, conversely, may create challenges in education, employment, and social stability. These demographic realities shape the landscape of societal development and governance.
A Crucial Area of Study
The study of age structure is, therefore, a crucial undertaking. It is necessary for policymakers, economists, and social scientists alike. It allows us to anticipate future needs, allocate resources effectively, and mitigate potential crises.
Ignoring these demographic realities comes at a steep cost.
Scope and Focus
This analysis aims to provide a comprehensive understanding of age structure and its wide-ranging implications. We will explore the factors that shape age distribution.
We will also examine its effects on various aspects of society.
Population Pyramids: A Visual Key
To visualize age structure, we rely on a powerful tool: the population pyramid. This graphical representation provides an immediate and intuitive depiction of a population's age and sex composition.
By understanding how to interpret these pyramids, we unlock a wealth of information about population trends and dynamics. More about them in the sections to follow.
Decoding Population Pyramids: A Visual Representation of Age Structure
Population pyramids serve as vital tools for demographers, offering a concise visual representation of a population's age and sex distribution. These graphical depictions are not merely static snapshots; they provide dynamic insights into historical trends and potential future trajectories. Understanding how to interpret these pyramids is crucial for anyone seeking to grasp the complexities of population dynamics.
Understanding the Structure of Population Pyramids
A population pyramid is essentially two histograms displayed horizontally, sharing a central vertical axis. One side typically represents males, and the other represents females.
The y-axis displays age cohorts, often in five-year increments. The x-axis represents the population size or the percentage of the population within each cohort.
The shape of the pyramid reveals a wealth of information about the population's past and present.
Interpreting Different Pyramid Shapes
The shape of a population pyramid is indicative of a nation's overall demographic profile. Distinct shapes reveal distinct demographic realities.
A pyramid with a broad base and a rapidly tapering top indicates a population with high birth rates and high death rates, characteristic of many developing countries. This shape is often referred to as an expansive pyramid.
Conversely, a pyramid with a narrow base and a wider top signifies an aging population with low birth rates and low death rates. This is typical of many developed countries and is known as a constrictive pyramid.
A more rectangular shape suggests a stable population with relatively constant birth and death rates across age groups. This is referred to as a stationary pyramid.
Example: Expansive Pyramid
Countries with high fertility rates and relatively low life expectancies, such as some nations in Sub-Saharan Africa, often exhibit expansive pyramids. These pyramids highlight the challenge of providing for a large youth population.
Example: Constrictive Pyramid
Japan, with its aging population and declining birth rate, showcases a constrictive pyramid. This shape raises concerns about future workforce shortages and the burden on social security systems.
Population Pyramids as Indicators of Demographic Trends
Population pyramids are powerful tools for identifying and analyzing demographic trends. They illustrate the effects of historical events, policy changes, and socio-economic factors on population structure.
Changes in birth rates, mortality rates, and migration patterns are all reflected in the pyramid's shape.
A bulge in the pyramid at a particular age cohort may indicate a baby boom, while a narrowing at a specific age group might reflect the impact of a famine or epidemic.
Case Study: The Impact of the Baby Boom
The post-World War II baby boom is clearly visible in the population pyramids of many Western countries. This bulge has had a significant impact on social security systems, healthcare infrastructure, and labor markets as the baby boomer generation ages.
Case Study: The Effects of the One-Child Policy
China's former one-child policy is evident in its population pyramid, particularly in the skewed sex ratio at birth. This policy has had profound and lasting consequences on Chinese society, including gender imbalances and an aging population.
By analyzing population pyramids, demographers can gain valuable insights into past demographic trends and make projections about future population growth, aging, and other critical demographic variables. These insights are essential for informed policy-making and effective resource allocation.
Demographic Foundations: An Essential Overview
Decoding Population Pyramids: A Visual Representation of Age Structure Population pyramids serve as vital tools for demographers, offering a concise visual representation of a population's age and sex distribution. These graphical depictions are not merely static snapshots; they provide dynamic insights into historical trends and potential future trajectories. Building upon this foundation, a deeper understanding of the broader field of demographics is crucial to fully grasp the complexities of age structure and its implications.
Demographics, at its core, constitutes a vast reservoir of statistical data meticulously collected and analyzed to paint a comprehensive picture of population characteristics. These characteristics encompass a wide array of variables, including age, sex, income, education, occupation, ethnicity, and geographic location.
This data is not simply a collection of numbers; it represents the very fabric of society, providing invaluable insights into its composition, dynamics, and future direction. Understanding demographics is thus fundamental to comprehending the forces that shape our world.
The Importance of Demographics in Understanding Societal Trends
Demographic data serves as a powerful lens through which we can examine and interpret societal trends and patterns. It allows us to identify shifts in population size, distribution, and composition, revealing underlying social, economic, and cultural changes.
For example, consider the increasing median age observed in many developed nations. This demographic trend, readily apparent in age structure data, signals a potential strain on social security systems, healthcare infrastructure, and labor force participation rates.
Similarly, shifts in educational attainment levels, often stratified by age and gender, can illuminate disparities in access to opportunities and inform policies aimed at promoting social equity. Demographic data, therefore, acts as an early warning system, alerting policymakers and stakeholders to emerging challenges and opportunities.
Another critical aspect of demographic analysis is its ability to reveal spatial patterns and regional disparities. Examining population density, migration flows, and demographic characteristics across different geographic areas can highlight areas of rapid growth, decline, or demographic transition.
This information is vital for urban planning, infrastructure development, and resource allocation, ensuring that communities are adequately prepared to meet the evolving needs of their populations. The granularity of demographic data enables targeted interventions and localized solutions.
The Role of Demographics in Informing Public Policy and Resource Allocation
Governments and organizations rely heavily on demographic data to make informed decisions about public policy and resource allocation. Accurate demographic information is essential for forecasting future needs, allocating resources efficiently, and designing effective programs that address specific population segments.
For instance, projections of school-age populations are crucial for planning educational infrastructure, allocating funding for schools, and training teachers. Similarly, estimates of the elderly population are vital for planning healthcare services, retirement benefits, and long-term care facilities.
Without reliable demographic data, policymakers would be operating in the dark, making decisions based on guesswork rather than evidence.
Demographic data also plays a critical role in evaluating the effectiveness of existing policies and programs. By tracking changes in key demographic indicators over time, policymakers can assess whether interventions are achieving their intended goals and identify areas for improvement.
For example, tracking fertility rates and maternal mortality rates can help evaluate the effectiveness of reproductive health programs. Analyzing income distribution and poverty rates can help assess the impact of social welfare policies. This feedback loop ensures that policies are continuously refined and adapted to meet the evolving needs of the population.
In conclusion, demographics provides the bedrock for understanding the complex interplay of social, economic, and political forces that shape our world. Its rigorous application is not merely an academic exercise but a fundamental necessity for informed governance and societal progress.
Key Demographic Rates: Unveiling Population Dynamics
Population pyramids serve as vital tools for demographers, offering a concise visual representation of a population's age and sex distribution. These graphical depictions are not merely static snapshots; they provide dynamic insight into the underlying demographic processes that shape a society. Understanding these processes requires a closer examination of key demographic rates, the vital statistics that drive population change.
These rates, including fertility, mortality, birth, death, and population growth, act as barometers of societal well-being and future prospects. A detailed exploration of these measures reveals the complex interplay of social, economic, and environmental forces that determine the trajectory of populations worldwide.
Fertility Rate: A Measure of Reproductive Output
The fertility rate, typically expressed as the total number of children a woman is expected to bear during her reproductive years (typically 15-49), is a primary driver of population growth. Globally, fertility rates have exhibited a significant downward trend in recent decades.
This decline is attributed to a multitude of factors, reflecting changing societal values and opportunities. Increased access to education, particularly for women, is strongly correlated with lower fertility rates.
Education empowers women, offering alternative life paths beyond motherhood and increasing their awareness of family planning options. Improved access to healthcare, including contraception and reproductive health services, also plays a crucial role.
Cultural norms and traditions also significantly influence fertility decisions, often reinforcing desired family sizes. Government policies, such as family planning programs and incentives for smaller families, can further shape fertility trends.
Mortality Rate: An Indicator of Societal Health
The mortality rate, usually measured as the number of deaths per 1,000 people in a given population per year, provides insights into the overall health and well-being of a society. Significant variations in mortality rates persist across different regions of the world.
Developed countries generally exhibit lower mortality rates due to advanced healthcare systems, improved sanitation, and access to nutritious food. Conversely, developing countries often face higher mortality rates due to challenges such as limited healthcare access, infectious diseases, and malnutrition.
Determinants of mortality extend beyond healthcare. Factors like sanitation and hygiene, access to clean water, and adequate nutrition play critical roles in reducing mortality rates.
Environmental conditions, including exposure to pollution and natural disasters, also significantly impact mortality levels.
Birth and Death Rates: The Foundation of Population Change
The birth rate, representing the number of live births per 1,000 people in a population per year, and the death rate, representing the number of deaths per 1,000 people in a population per year, are fundamental measures of population dynamics.
Historical patterns of birth and death rates reveal significant shifts over time. In pre-industrial societies, both birth and death rates were generally high, resulting in relatively stable population sizes.
The demographic transition, characterized by a decline in both birth and death rates, has been observed in many countries as they undergo economic development. Socio-economic factors exert a profound influence on both birth and death rates.
Economic development often leads to improved living standards, better healthcare, and increased access to education, contributing to lower death rates. Higher levels of education and urbanization may lead to smaller family sizes, resulting in lower birth rates.
Resource availability, including access to food, water, and energy, also plays a crucial role in shaping birth and death rates, particularly in developing countries.
Population Growth Rate: A Synthesis of Demographic Forces
The population growth rate is the rate at which the number of individuals in a population increases (or decreases) in a given time period, expressed as a percentage of the initial population. It represents the net effect of births, deaths, and migration.
Migration, the movement of people from one place to another, significantly influences population growth rates, particularly in specific regions or countries. Population projections, based on current trends in fertility, mortality, and migration, are used to forecast future population sizes and distributions.
These projections carry significant implications for resource planning, infrastructure development, and social policy. Understanding the dynamics of population growth is essential for addressing challenges such as resource scarcity, environmental degradation, and social inequality.
Generational Cohorts: Shaping Society and the Economy
Population pyramids serve as vital tools for demographers, offering a concise visual representation of a population's age and sex distribution. These graphical depictions are not merely static snapshots; they provide dynamic insight into the underlying demographic processes that shape a society. One crucial aspect of this societal architecture is the concept of generational cohorts – groups of individuals born within a specific time frame who share similar formative experiences. Understanding these cohorts is paramount to grasping the multifaceted shifts occurring within our social and economic landscapes.
Defining and Understanding Generational Cohorts
Generational cohorts are defined as groups of individuals born within a specific period, typically spanning 15-20 years. These cohorts share common historical, social, and cultural experiences that shape their values, beliefs, and behaviors. The study of generational cohorts is crucial for understanding how societies evolve, adapt, and respond to various challenges and opportunities.
The shared experiences of a generation – be they economic booms, periods of conflict, or technological revolutions – fundamentally influence their worldview. For example, those who came of age during the Great Depression developed a distinct sense of frugality and resilience, whereas those who grew up in the digital age possess a natural fluency with technology that sets them apart.
Understanding the dynamics of generational shifts enhances our ability to anticipate societal trends and effectively plan for the future.
The Impact of Cohort Size: A Demographic Lever
The size of a generational cohort can have profound implications for social and economic systems. A large cohort can strain resources, increase competition for jobs and housing, and influence political landscapes. Conversely, a smaller cohort might face challenges related to labor shortages and diminished economic productivity.
Large generations, like the Baby Boomers, have exerted significant influence on everything from housing markets to healthcare systems. Their sheer numbers have amplified their impact, creating both opportunities and challenges for successive generations.
Smaller generations, such as Generation X, have often navigated a world shaped by the preceding, larger cohort.
Understanding these dynamics is crucial for policymakers and economists seeking to address the unique needs and challenges of different generations.
Analyzing Specific Generations: A Comparative Overview
Examining specific generations allows us to appreciate the diversity of experiences and perspectives that shape our society.
Boomers (Baby Boomers): The Post-War Wave
Born roughly between 1946 and 1964, the Baby Boomers represent a significant demographic wave following World War II. Their formative years were marked by economic prosperity, social change, and the rise of consumer culture. They significantly influenced societal norms, values, and political agendas.
Their impact on healthcare and social security systems remains a central concern as they enter retirement. Boomers are also known for their work ethic and contributions to various industries.
Generation X: The Latchkey Generation
Generation X, born approximately between 1965 and 1980, often gets overshadowed by its predecessor and successor. Growing up during a period of economic uncertainty and rapid technological change, Gen Xers are often characterized as independent, resourceful, and adaptable.
Their economic experiences, marked by corporate restructuring and globalization, have shaped their approach to work and career.
Gen X's cultural contributions are notable in music, film, and literature, reflecting their unique perspective on the world.
Millennials (Generation Y): The Digital Natives
Millennials, born between 1981 and 1996, came of age during the rise of the internet and mobile technology. This generation is characterized by its digital fluency, entrepreneurial spirit, and a desire for meaningful work.
Their integration of technology into all aspects of life has transformed industries and redefined social interactions.
Millennials are known for their emphasis on work-life balance and their commitment to social causes. They also face unique challenges related to student debt and economic instability.
Generation Z: The Digital Natives
Generation Z, born after 1997, represents the first generation to have grown up entirely in the digital age. They are highly connected, socially conscious, and adaptable.
Their defining characteristics include their comfort with technology, their emphasis on diversity and inclusion, and their entrepreneurial spirit.
Gen Z's future prospects are closely tied to technological advancements and the evolving global landscape. Their impact on social media, e-commerce, and the future of work is already being felt.
Factors Influencing Age Structure: A Multifaceted Perspective
Generational Cohorts: Shaping Society and the Economy Population pyramids serve as vital tools for demographers, offering a concise visual representation of a population's age and sex distribution. These graphical depictions are not merely static snapshots; they provide dynamic insight into the underlying demographic processes that shape a society. These processes are deeply interwoven with socio-economic realities and geographical specificities, creating a complex tapestry of factors that mold a population's age structure.
Understanding these factors is essential for anticipating future challenges and opportunities, as well as for crafting effective policies that address the evolving needs of a society.
The Triad of Influence: Education, Healthcare, and Economic Conditions
Education, healthcare, and economic conditions form a critical triad that profoundly shapes a population's age structure. Access to quality education, particularly for women, is strongly correlated with lower fertility rates.
Empowered women with higher educational attainment tend to delay marriage and childbirth, opting instead to pursue career opportunities and personal development. This, in turn, leads to a slower population growth rate and a shift towards an older age structure.
Robust healthcare systems contribute significantly to increased life expectancy. Improved access to prenatal care, vaccinations, and treatments for chronic diseases translates into lower mortality rates, particularly among infants and children.
This results in a larger proportion of the population surviving into older age, leading to a demographic transition where the median age increases.
Economic prosperity plays a pivotal role in shaping both fertility and mortality patterns. In economically developed countries, better nutrition, sanitation, and living conditions contribute to improved health outcomes and longer lifespans.
Conversely, economic hardship and inequality can exacerbate health disparities and lead to higher mortality rates, especially in vulnerable populations.
Public Policies and Social Programs: Steering Demographic Trends
Public policies and social programs act as significant levers that can influence age structure. Pro-natalist policies, for instance, aim to boost fertility rates through various incentives such as childcare subsidies, tax breaks for families with children, and parental leave programs.
These policies are often implemented in countries facing declining birth rates and an aging population.
Conversely, other policies may focus on promoting family planning and access to contraception, particularly in regions with high population growth rates.
Policies related to healthcare access, retirement benefits, and immigration also have a profound impact on age structure. Universal healthcare systems can extend life expectancy and reduce mortality rates, while pension reforms can influence retirement patterns and the proportion of elderly individuals in the workforce.
Socio-Economic Stratification: The Uneven Distribution of Demographic Outcomes
Variations across different socio-economic strata reveal stark disparities in age structure. Higher-income groups often have access to better healthcare, education, and nutrition, which translates into longer life expectancies and lower fertility rates.
Conversely, lower-income groups may face barriers to accessing these essential resources, leading to higher mortality rates and larger family sizes.
These socio-economic disparities can create distinct demographic profiles within a single society, highlighting the impact of inequality on population dynamics.
These disparities can create distinct demographic profiles within a single society, highlighting the impact of inequality on population dynamics.
Geographical Variations: A Mosaic of Demographic Landscapes
Geographical variations in age structure reflect a complex interplay of environmental, economic, and cultural factors.
States within the US: Contrasting Demographic Profiles
Florida, with its warm climate and retiree-friendly policies, has a significantly older population compared to the national average.
California, on the other hand, benefits from a younger population fueled by immigration and a vibrant economy. Texas exhibits a more balanced age structure, driven by a combination of economic growth, migration, and a relatively high birth rate.
Metropolitan Areas: Urban Demographic Dynamics
New York City and Los Angeles are characterized by diverse populations with relatively younger age structures, driven by international migration and a concentration of young professionals.
These urban centers also exhibit pockets of aging populations in certain neighborhoods, reflecting the complex demographic tapestry of metropolitan areas.
Rural Areas: The Challenges of an Aging Countryside
Rural areas often face the challenge of an aging population as younger residents migrate to urban centers in search of educational and employment opportunities.
This exodus of youth leaves behind an older population with limited access to healthcare and social services, posing significant challenges for the sustainability of rural communities.
Data Sources and Analytical Tools: The Foundation of Demographic Studies
Population pyramids serve as vital tools for demographers, offering a concise visual representation of a population's age and sex distribution. These graphical depictions are not merely static snapshots; they provide dynamic insight into population trends and societal transformations. However, the creation and interpretation of these pyramids, and indeed any meaningful demographic analysis, hinge upon reliable data sources and appropriate analytical instruments.
The integrity of demographic studies rests on the quality of the data employed and the rigor of the methodologies applied. This section explores the primary data sources fueling demographic research, focusing particularly on the United States Census Bureau, and examines the analytical tools indispensable for dissecting and visualizing age structure.
The United States Census Bureau: A Cornerstone of Demographic Data
The United States Census Bureau stands as a preeminent source of demographic information, not only for the United States but also as a model for statistical agencies worldwide. Established in 1902, the Bureau's constitutional mandate to conduct a decennial census forms the backbone of its data collection efforts.
However, its activities extend far beyond the ten-year headcount.
Data Collection Methodologies
The Census Bureau employs a diverse array of data collection methods to capture a comprehensive portrait of the nation's population. The decennial census, conducted every ten years, aims for a complete count of all residents.
This is supplemented by ongoing surveys, such as the American Community Survey (ACS), which provides annual estimates of key demographic, social, economic, and housing characteristics.
The ACS is particularly valuable for tracking trends between decennial censuses, offering a more timely picture of population dynamics. Furthermore, the Bureau leverages administrative records from other government agencies to enhance its data and reduce respondent burden.
Evaluating Census Data: Accuracy, Reliability, and Scope
While the Census Bureau strives for accuracy and comprehensiveness, its data is not without limitations. Understanding these strengths and weaknesses is crucial for responsible interpretation and application.
Accuracy and Reliability
The accuracy of census data is a perennial concern, particularly regarding undercounting of certain population groups, such as racial and ethnic minorities, low-income individuals, and undocumented immigrants.
The Bureau employs sophisticated statistical techniques to mitigate these biases, but some degree of error is inevitable. Reliability is also affected by factors such as response rates and the quality of responses provided.
Scope and Limitations
The scope of census data is extensive, covering a wide range of demographic, social, and economic variables. However, certain topics may be excluded or covered in less detail due to privacy concerns, cost considerations, or other constraints.
Furthermore, census data represents a snapshot in time and may not fully capture the dynamic nature of population change. The American Community Survey addresses this to some extent but relies on sampling techniques, which introduces a margin of error.
Utilizing Census Data: Demographic Studies and Policy Formulation
Despite its limitations, census data remains an indispensable resource for demographic studies and policy formulation. Its comprehensive coverage and standardized methodology enable researchers to analyze population trends, identify disparities, and assess the impact of social and economic policies.
Informing Research and Decision-Making
Researchers use census data to investigate a wide range of topics, from population growth and distribution to socioeconomic inequality and health disparities. These findings, in turn, inform policy decisions at all levels of government.
For example, census data is used to allocate federal funding, redraw electoral districts, and plan for infrastructure development. It also provides essential information for businesses, non-profit organizations, and community groups.
Analytical and Visualization Tools: Unveiling Patterns in Age Structure
Analyzing and visualizing age structure requires specialized tools that can handle large datasets and generate informative graphics. While sophisticated statistical software packages are available, spreadsheet software remains a valuable and accessible option for basic demographic analysis.
Spreadsheet Software: A Versatile Tool
Software such as Microsoft Excel and Google Sheets offer a range of functions for analyzing and visualizing demographic data. These tools can be used to calculate key indicators, such as median age and dependency ratios, and to create population pyramids.
While spreadsheet software may not have the advanced capabilities of specialized statistical packages, its ubiquity and ease of use make it a valuable resource for demographers and policymakers alike. For preliminary analysis and visual representation, they provide the basic capabilities needed.
Social, Economic, and Policy Implications of Age Structure
Population pyramids serve as vital tools for demographers, offering a concise visual representation of a population's age and sex distribution. These graphical depictions are not merely static snapshots; they provide dynamic insight into population trends and societal transformations, which necessitate a deep dive into the resulting social, economic, and policy implications.
The age structure of a population significantly influences a nation's social fabric, economic stability, and the effectiveness of its public policies. As populations age or become increasingly skewed towards certain age groups, profound challenges and opportunities emerge, demanding careful consideration and strategic planning.
Strain on Social Security and Healthcare Systems
An aging population presents a significant challenge to social security and healthcare systems worldwide. As the proportion of elderly individuals increases relative to the working-age population, the burden on social security systems intensifies.
Fewer workers are available to contribute to the system, while more retirees are drawing benefits, creating a potential fiscal imbalance. This demographic shift necessitates reforms to ensure the long-term solvency of these vital social safety nets.
Similarly, healthcare systems face increased demand as the elderly tend to require more medical services and long-term care. The costs associated with managing age-related diseases, such as Alzheimer's and heart disease, can strain healthcare budgets, necessitating innovative solutions like preventative care and efficient resource allocation.
Evolving Family Structures and Intergenerational Dynamics
Changes in age structure also impact family structures and intergenerational dynamics. With increasing life expectancy and declining fertility rates, families are becoming smaller and more multi-generational.
This can lead to challenges in elder care, as fewer younger family members are available to provide support. Conversely, extended lifespans can foster stronger intergenerational relationships and the transmission of knowledge and values across generations.
Understanding these evolving family dynamics is crucial for developing policies that support families and promote social cohesion.
Impact on Labor Force Participation and Productivity
The age structure of a population directly affects labor force participation and productivity. A shrinking working-age population can lead to labor shortages, reduced economic output, and decreased innovation.
Countries with aging populations may need to encourage older workers to remain in the workforce longer through policies that promote lifelong learning, flexible work arrangements, and age-friendly workplaces.
Furthermore, investments in education and training are essential to ensure that the workforce has the skills necessary to compete in an increasingly globalized and technologically advanced economy.
Economic Repercussions: Growth, Stability, and Consumer Behavior
The economic impacts of shifting age structures are far-reaching. Population aging can influence economic growth and stability by altering savings rates, investment patterns, and aggregate demand.
A larger elderly population may lead to a decrease in savings rates, as retirees draw down their accumulated savings to finance consumption. This can affect investment and capital formation, potentially slowing economic growth.
Additionally, changing age structures impact consumer markets and investment strategies. Demand for certain goods and services, such as healthcare and retirement housing, may increase, while demand for others, such as education and childcare, may decline.
Businesses need to adapt their strategies to cater to the changing needs and preferences of different age cohorts.
The Fiscal Tightrope: Supporting an Aging Population
One of the most pressing economic challenges associated with aging populations is the fiscal burden of supporting a growing number of retirees. Governments must find ways to finance social security and healthcare systems while maintaining economic competitiveness and ensuring fiscal sustainability.
This may involve raising taxes, reducing benefits, increasing retirement ages, or implementing other policy measures. Finding the right balance is essential to avoid overburdening younger generations and stifling economic growth.
Policy Responses to Demographic Shifts
Governments play a critical role in managing the challenges and opportunities presented by changing age structures. Proactive policies are needed to address the economic, social, and healthcare implications of population aging.
Navigating Population Aging: The Government's Role
The role of government in managing population aging is multifaceted. It includes ensuring the solvency of social security and healthcare systems, promoting workforce participation, investing in education and training, and supporting families.
Governments can also implement policies that encourage immigration to offset declining birth rates and address labor shortages. Additionally, investing in research and development can drive innovation and create new economic opportunities for an aging society.
Tailoring Strategies for Demographic Challenges
Effective strategies for addressing demographic challenges must be tailored to the specific circumstances of each country or region. There is no one-size-fits-all solution.
Some countries may need to focus on increasing fertility rates through policies that support families, while others may need to prioritize attracting and retaining skilled immigrants.
Charting a Sustainable Course: Policy Recommendations
Policy recommendations for promoting sustainable development in light of age structure changes include:
- Increasing the retirement age: This can help to alleviate the strain on social security systems and encourage older workers to remain in the workforce longer.
- Promoting lifelong learning: Investing in education and training can help workers adapt to changing job demands and remain productive throughout their careers.
- Encouraging private savings: Providing incentives for individuals to save for retirement can reduce the burden on public pension systems.
- Investing in preventative healthcare: Promoting healthy lifestyles and providing access to preventative care can help to reduce the costs associated with age-related diseases.
- Creating age-friendly communities: Designing communities that are accessible and supportive for older adults can help them to remain independent and engaged in their communities.
By implementing these and other policies, governments can help to mitigate the challenges of population aging and create a more sustainable and equitable future for all.
Video: Age Structure Diagram: US Population Guide

FAQs: Age Structure Diagram: US Population Guide
What information does an age structure diagram show?
An age structure diagram displays the distribution of a population by age groups and sex. It essentially provides a snapshot of a population, showing how many males and females exist within each age category. This data gives insights into the potential for future population growth or decline.
How can an age structure diagram predict population growth?
A diagram with a wide base (many young people) suggests future population growth, as these individuals will eventually reproduce. A diagram with a narrower base indicates slower growth or potential decline, as there are fewer young people to replace the older generations. Analyzing the shape of the age structure diagram helps in predicting these demographic trends.
What does a bulge in an age structure diagram indicate?
A bulge in the age structure diagram represents a larger-than-usual cohort, like the baby boomers in the US. This bulge affects social and economic planning, as that group requires specific resources and services as it ages. The age structure diagram reveals these important demographic shifts.
Where can I find accurate age structure diagram data for the US?
Reliable sources include the US Census Bureau website and publications. The Population Reference Bureau (PRB) is another good option. These sources provide updated age structure diagram visualizations and related demographic information for the United States.
So, next time you're wondering about the future of the US, remember that handy age structure diagram. It's not just a bunch of bars and percentages; it's a peek into the years to come and how the population is changing, impacting everything from social security to the housing market. Pretty interesting stuff, right?